 Lotus Institute


News
Lotus Institute

VN-INDEX EXPLODES STRONGLY - GOLD REVERSES TO BULLISH: TRADING STRATEGY APR 01
MARKET OVERVIEW
Release Time: 10:00, April 01, 2026 Issuer: Mr. Leon
1. Stock Market:
Vietnam Market: The VN-Index is bringing an extremely explosive picture for the Buyers. The chart records a vertical price surge with a long real-body green candle, decisively piercing through the entire EMA resistance cluster and reaching the 1713.83 point mark. This breakout has completely broken the previous bearish structure. Extremely strong FOMO momentum pulled the Stochastic indicator straight into the overbought ceiling. The bullish rhythm completely shakes out the Sellers, but you need to note that when the price rises abruptly and distances itself from the moving average cluster, T+ profit-taking pressure will soon appear. You should prioritize holding strong portfolios and wait for retests to increase the proportion.
US Market:Price Structure: US100 is presenting a definitive downtrend picture. The price is plunging heavily, continuously creating lower highs and lower lows, and trading around the $23,109 mark. The gap between the price and the MA cluster (red ribbon) is widening, with the MA expanding its downward crossing angle.Momentum: Stochastic is diving straight into the deep oversold mark (below 20). However, the bearish momentum remains massive.
2. Forex:
EUR/USD is repeating Gold's structure with an extremely definitive Downtrend. The price is plunging heavily, continuously creating lower highs and lower lows, and is heavily suppressed under the MA resistance ribbon (downward-sloping red ribbon), currently trading around the 1.07890 USD mark. Stochastic is also diving straight into the oversold zone with no signs of cooling down, confirming that the sell-off momentum is very strong. Logically, Sellers are absolutely dominating, and you should prioritize trend-following Sell positions. Do not bottom-fish under any circumstances.
GU is weaker compared to EU. The price is sliding, continuously creating lower highs and lower lows, and is heavily suppressed under the MA resistance cluster, currently trading around the 1.3366 mark. Unlike EU, GU currently does not have any truly solid technical support zone right below it.
3. Gold:
The Gold chart is showing an extremely strong trend reversal to Bullish. The price has decisively broken through the entire EMA resistance cluster (EMA 17, 34, 67) and reached the 4688 USD/ounce mark. The EMA lines are starting to curve upwards, supporting this new bullish structure. Buying momentum is very aggressive, pushing the Stochastic indicator deep into the extreme overbought zone (above 80). In terms of market logic, Buyers have regained control. However, with the momentum being overstretched, you should patiently wait for a Pullback to retest the recently broken EMA cluster to find trend-following Buy points instead of FOMO chasing the price.
4. Oil:
Contrary to Gold's breakout, the Oil chart is falling into a narrow-margin tug-of-war Consolidation state. The price is trading around the 98.273 USD mark and continuously crossing up and down the EMA cluster. The moving averages (EMA 17, 34, 67) are tightly twisted together and sloping horizontally, confirming the lack of a clear trend. The Stochastic indicator is also fluctuating upwards, but in a Sideway price structure, this signal has a high level of noise. The safest trading logic right now is to stand aside and observe, waiting for Oil to finish compressing and definitively break out of the EMA cluster to determine the next trend.
5. Bitcoin:
Bitcoin is still in a short-term Downtrend structure dominated by the blue diagonal Trendline. The price is currently trading around the 67612 USD mark after bouncing from the 66,000 USD bottom zone, but is facing the EMA resistance cluster right above. The Stochastic indicator is approaching the overbought zone, indicating that the room for this technical bounce might be limited. To escape the negative situation, BTC must have a definitive Breakout to shatter the diagonal resistance Trendline. As long as the price remains below the Trendline, the market's priority is still to look for Sell on Rally opportunities at resistance levels.
RECOMMENDATIONS:
1. USD/JPY:Buy Entry: 158.751 Stop Loss: 158.344 Take Profit: 159.928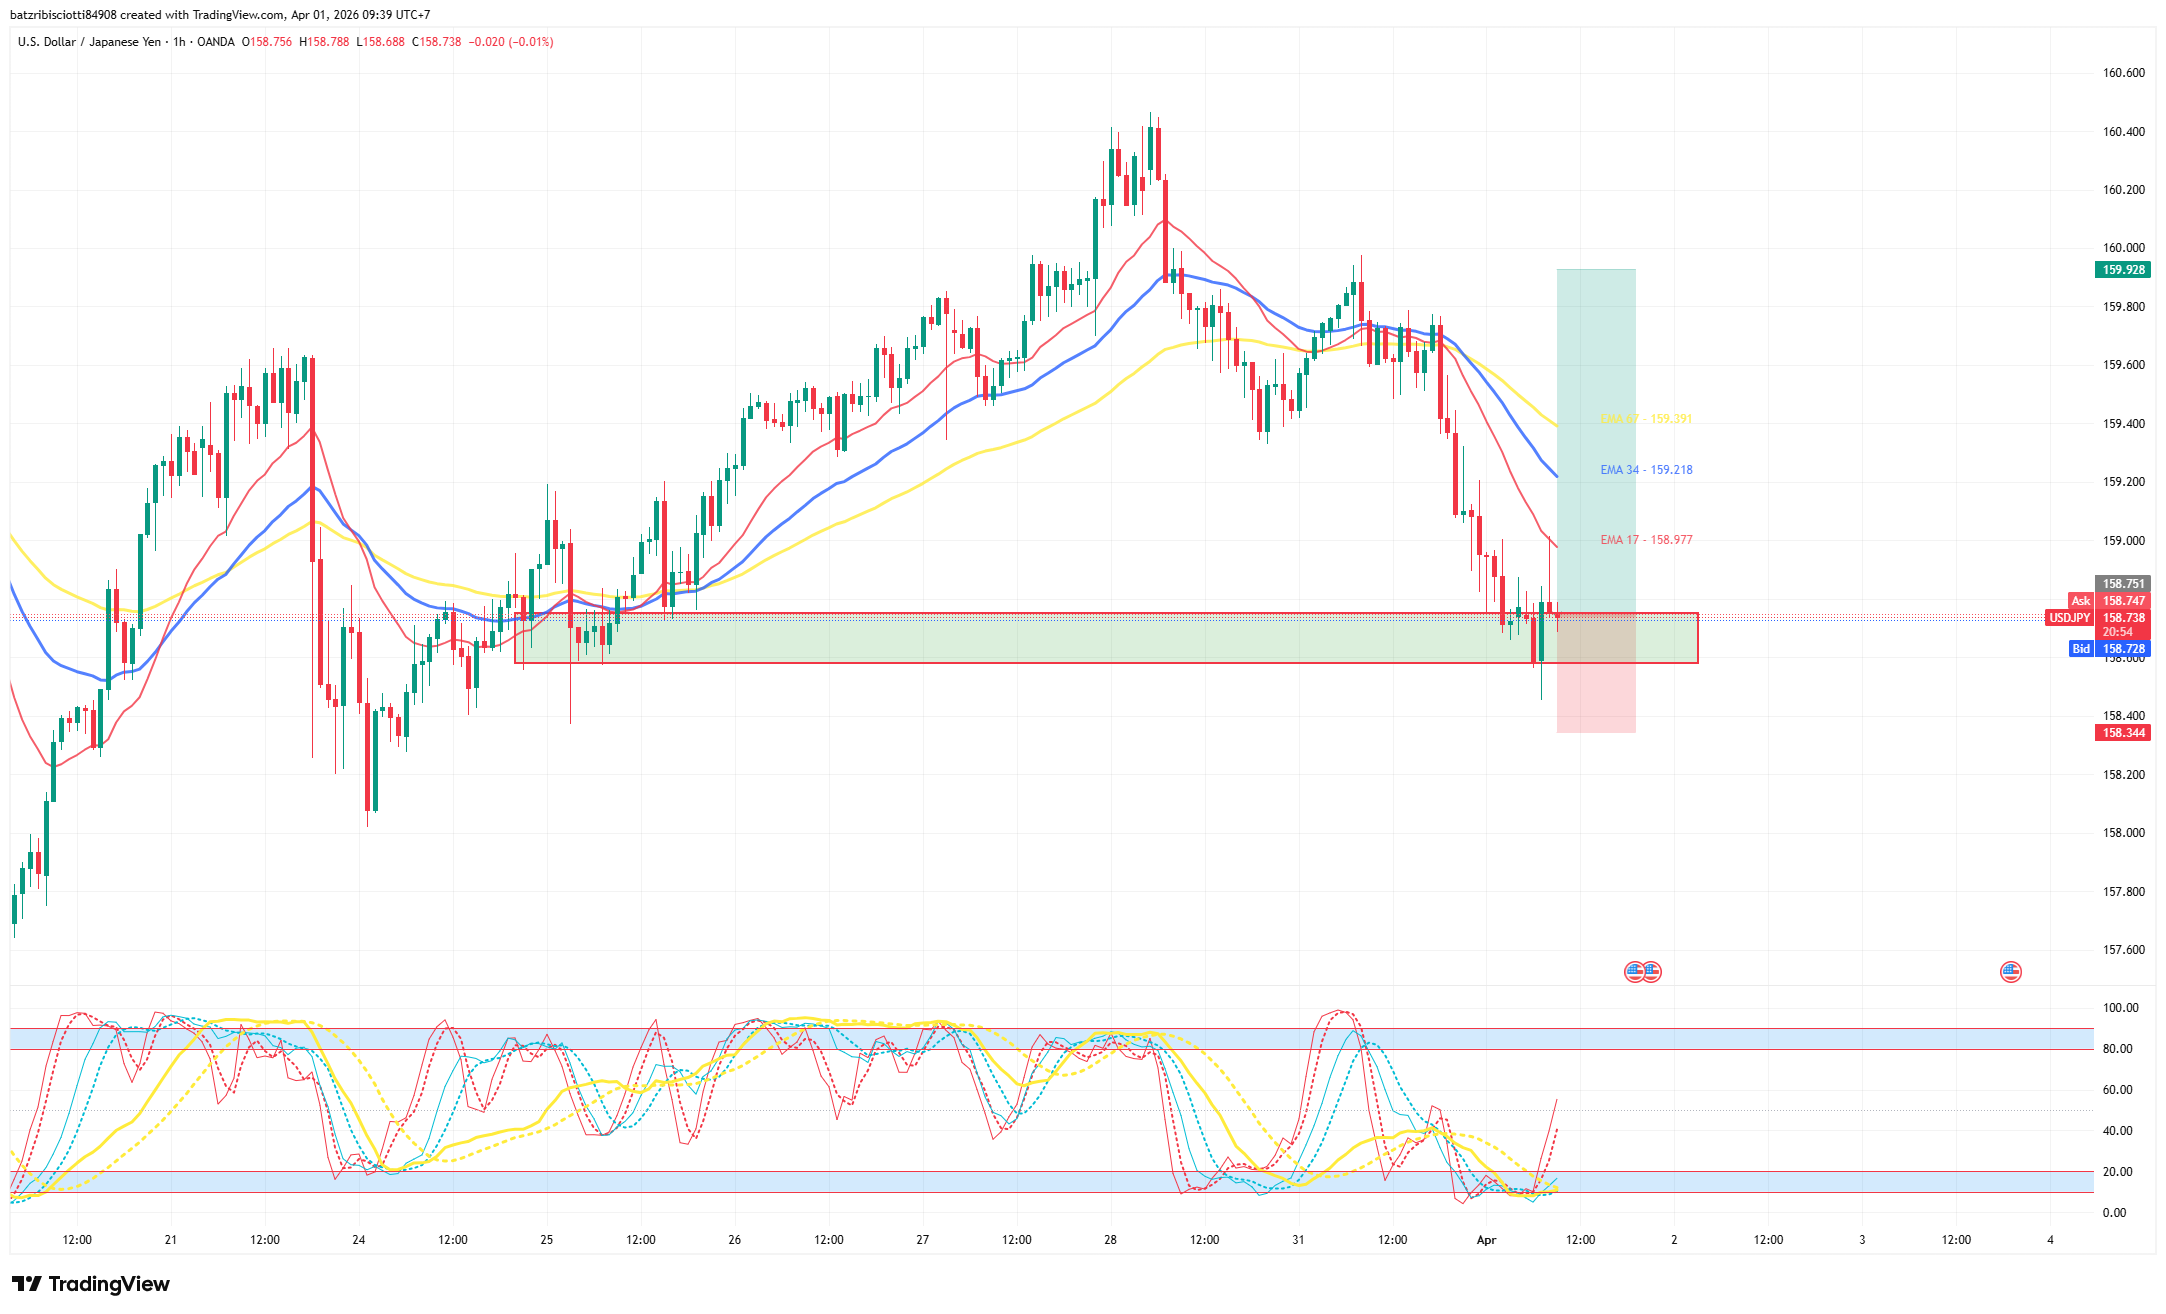
NOTABLE EVENTS TODAY:

DISCLAIMER:
The above analysis represents the personal views of analyst Leon from Lotus and does not constitute a basis for actual market participation. Lotus only provides technical trading analysis and trading knowledge training for students. Lotus does not represent any securities company or asset management firm. Lotus does not accept capital management for students.


_-25-03-2026-09-18-53.png "VN-INDEX GIẰNG CO DƯỚI 1.730 ĐIỂM - VÀNG & EUR/USD TIẾP TỤC SUY YẾU: CHIẾN LƯỢC 25/03")
