 Lotus Institute


News
Lotus Institute

OIL MAINTAINS STRONG UPTREND - GOLD & EU PLUNGE: TRADING STRATEGY MAR 30
MARKET OVERVIEW
Release Time: 10:00, March 30, 2026 Issuer: Mr. Leon
1. Stock Market:
Vietnam Market: The VN-Index is in a technical Recovery phase after a deep plunge. The index is trading around the 1,284.09 mark. After dropping sharply to test the old bottom, VN-Index had a quite impressive V-shaped snapback. However, the previous downward momentum is still massive, causing the MA ribbon to start moving sideways for accumulation rather than curving up completely. Stochastic is lying flat in the oversold zone (below 20) with no clear signs of crossing up. Logically, this bounce acts more like a short-squeeze than an official trend reversal. You should be cautious, avoid FOMO buying, and wait for the price to compress tighter around the MA cluster to confirm a short-term bottom.
US Market: Price Structure: US100 is presenting a definitive downtrend picture. The price is plunging heavily, continuously creating lower highs and lower lows, and trading around the $23,109 mark. The gap between the price and the MA cluster (red ribbon) is widening, with the MA expanding its downward crossing angle. Momentum: Stochastic is diving straight into the deep oversold mark (below 20). However, the bearish momentum remains massive.
2. Forex:
EUR/USD is repeating Gold's structure with an extremely definitive Downtrend. The price is plunging heavily, continuously creating lower highs and lower lows, and is heavily suppressed under the MA resistance ribbon (downward-sloping red ribbon), currently trading around the 1.07890 USD mark. Stochastic is also diving straight into the oversold zone with no signs of cooling down, confirming that the sell-off momentum is very strong. Logically, Sellers are absolutely dominating, and you should prioritize trend-following Sell positions. Do not bottom-fish under any circumstances.
GU is weaker compared to EU. The price is sliding, continuously creating lower highs and lower lows, and is heavily suppressed under the MA resistance cluster, currently trading around the 1.3366 mark. Unlike EU, GU currently does not have any truly solid technical support zone right below it.
3. Gold:
Gold is showing a very clear Bearish structure in the short term. The price is trading around the 2232 USD/ounce mark and is completely below the heavily downward-sloping MA resistance ribbon (red ribbon). The current price action shows a continuing downward push after being rejected at this dynamic resistance band. The Stochastic indicator also confirms the bearish momentum as the signal lines are sloping down from the Overbought zone and show no signs of crossing up to form a bottom. Logically, Sellers are completely controlling the game, and Gold is likely to continue its downward momentum to retest lower bottoms in today's session.
4. Oil:
Contrary to Gold, Oil is maintaining an extremely strong and resilient Uptrend structure. The chart records the price trading around the 83.166 USD mark and holding firm above the MA support ribbon (upward-sloping red ribbon). Right at this moment, the Oil price has just touched this MA band and is experiencing a technical bounce (the nth touch), confirming this is a very solid dynamic support zone. The bullish momentum is also supported by the Stochastic indicator as the signal lines have crossed up in the Oversold zone and are hooking up strongly. The safest logic is that Buyers still have absolute dominance, and you should prioritize Long positions when Oil has technical corrections to the MA support band.
5. Bitcoin:
Bitcoin is showing a rather complex Range-bound structure at the peak zone. The chart records the price trading around the 70331 USD mark and being tightly compressed in an accumulation box (the purple box on the chart). The MA lines are twisting together and moving horizontally, giving no definitive trend signals. Currently, BTC just had a V-shaped recovery from the bottom of the box (68k zone) to near the top of the box (71k zone) and is starting to stall. Stochastic is also giving a neutral signal as it hovers in the middle zone (around the 50-60 level) and has not confirmed the next trend. Logically, you should patiently stand aside and observe, waiting for the price to completely break out of this accumulation box to confirm the major direction.
RECOMMENDATIONS:
1. GOLD: SELL STOP: 4457 Stop Loss: 4529 Take Profit: 4318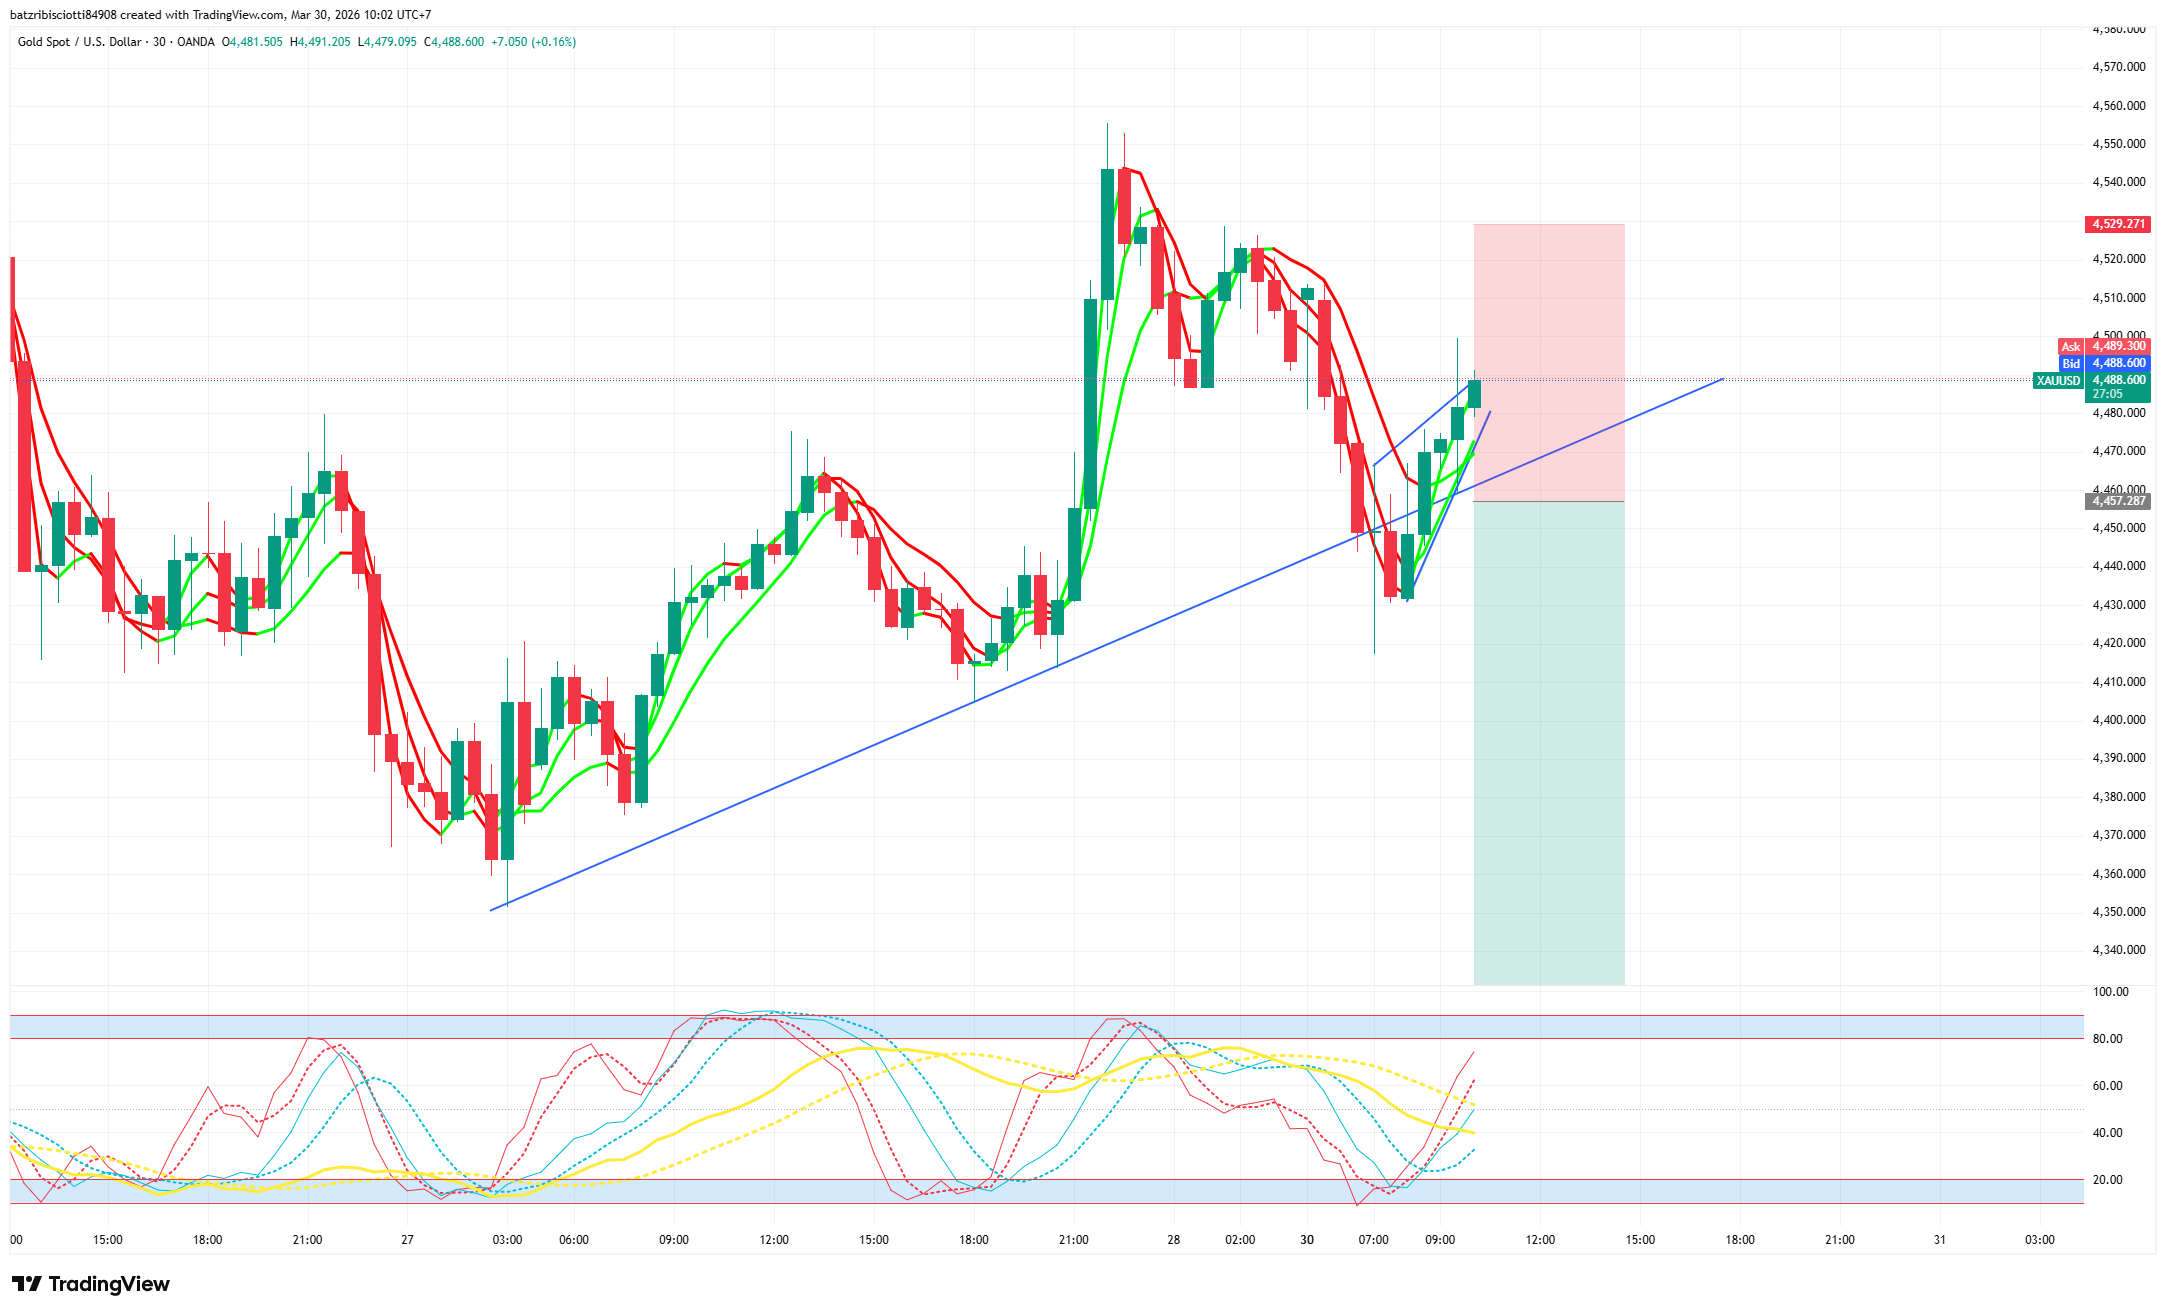
NOTABLE EVENTS TODAY:
9:30 PM | USD Fed Chair Powell Speaks
DISCLAIMER:
The above analysis represents the personal views of analyst Leon from Lotus and does not constitute a basis for actual market participation. Lotus only provides technical trading analysis and trading knowledge training for students. Lotus does not represent any securities company or asset management firm. Lotus does not accept capital management for students.


_-25-03-2026-09-18-53.png "VN-INDEX GIẰNG CO DƯỚI 1.730 ĐIỂM - VÀNG & EUR/USD TIẾP TỤC SUY YẾU: CHIẾN LƯỢC 25/03")

