 Lotus Institute


News
Lotus Institute

GOLD FORMS CLASSIC HIGH-BASE CONSOLIDATION - BITCOIN FACES SELLING PRESSURE: TRADING STRATEGY MAR 03
Release Time: 10:00, March 03, 2026 Issuer: Mr. Leon
MARKET OVERVIEW
1. Stock Market:
-
Vietnam Market: The market lost its balance as it fell below the 1,860 points mark with increasing liquidity, indicating rising selling pressure ahead of global volatility. The downward momentum may continue, driving the index to test the 1,825–1,834 gap area and evaluate the MA(20) support. However, if well-supported in this zone, the market still has a chance to recover and retest the 1,860 resistance.
-
US Market: In the March 2 session, Wall Street closed with high volatility and divergence as investor sentiment was weighed down by geopolitical tensions and rising oil prices. The S&P 500 edged up ~0.04% to ~6,881.62 points, the Nasdaq Composite gained ~0.36% to ~22,748.86 points, while the Dow Jones Industrial Average dropped ~0.15% to ~48,904.78 points. The high intraday volatility reflects concerns over global risks, but buying interest in the tech and defensive sectors prevented the main indices from falling deeply.
2. Forex:
-
GBP/USD: Dominant trend is Bearish. Daily resistance: 1.34500; Daily support: 1.33100. Consider Short positions if price breaks the daily support zone.
-
USD/CHF: Dominant trend is Bullish. Daily resistance: 0.78100; Daily support: 0.76700. Consider Short positions if price breaks the daily support zone.
3. Gold:
-
Performance & Structure: Following the historic Gap-up, Gold has not experienced the gap-fill sell-off anticipated by common trading psychology. Instead, the price is establishing a High-base Consolidation and moving sideways around the $5,364 mark. The structure of intertwined small candles shows that Buyers are actively supporting the price and fully absorbing short-term profit-taking pressure.
-
Momentum: The Triple Stochastic indicator has cooled down from the extreme overbought threshold and is hovering in the 60 - 80 zone. The sideways price action (a time correction) while momentum cools down is a highly Bullish signal for Buyers, allowing the market to recharge without breaking the uptrend structure.
4. Oil:
-
XTI/USD: Dominant trend is Bullish. Daily resistance: 75.10; Daily support: 70.20. Consider Long positions if price breaks the daily resistance zone.
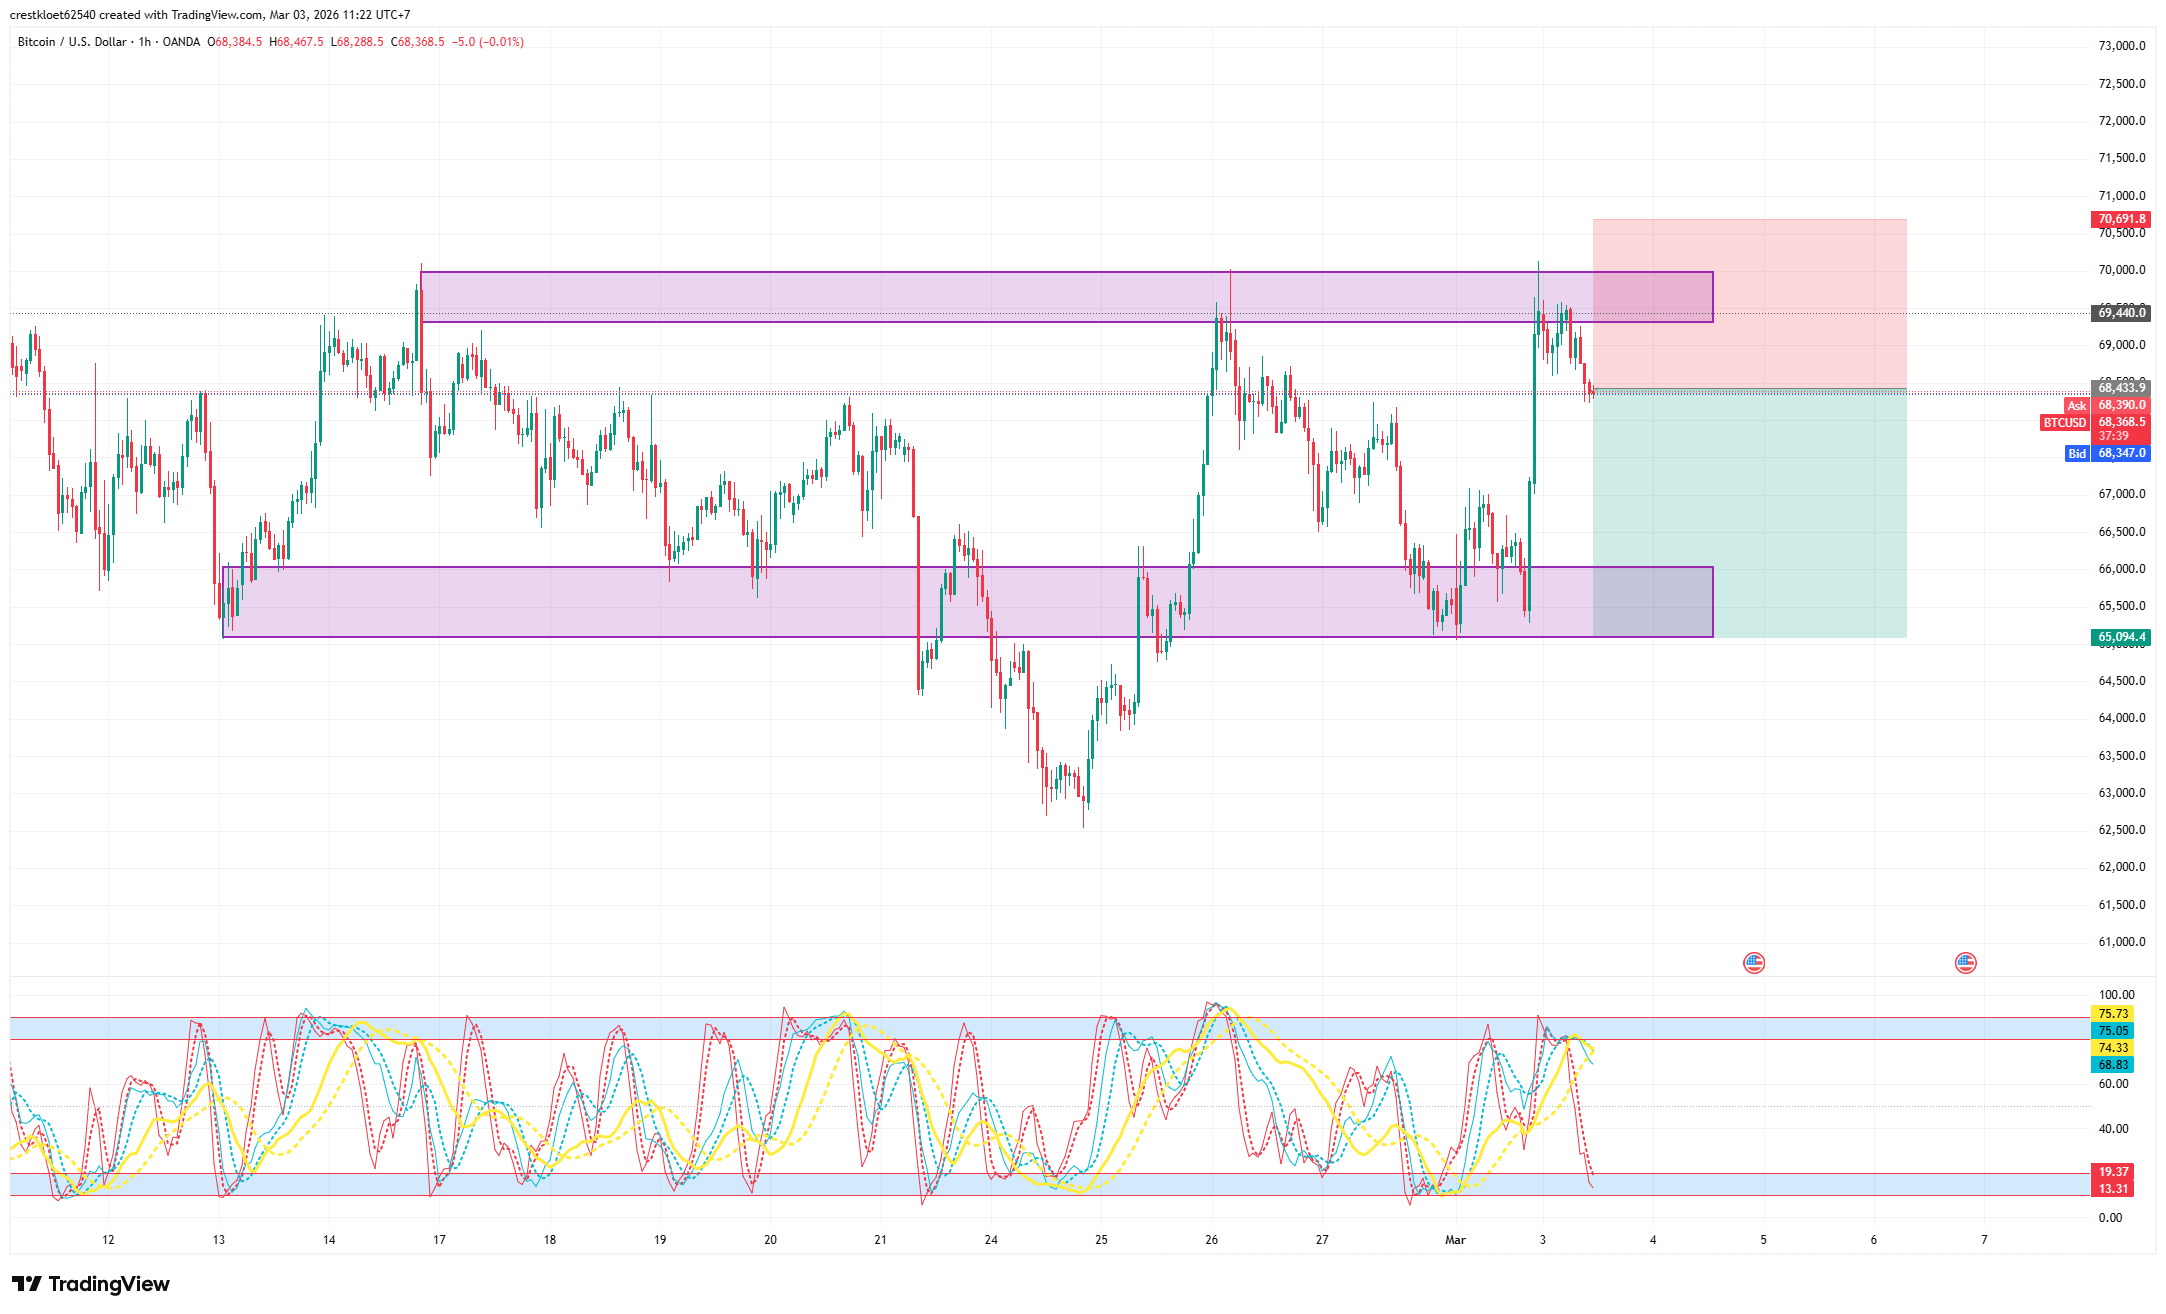
5. Bitcoin:
-
Performance & Structure: Contrary to Gold's strength, Bitcoin just made an unsuccessful Retest of the stiff resistance zone around 69,440. Strong selling pressure emerged, forcing the price to reverse, and it is currently pulling back to trade around $68,313. The H1 timeframe is facing clear supply pressure from the previous peak.
-
Momentum: The sell-off signal is sharply depicted by the Triple Stochastic. The fast signal lines (red) have sharply angled down from the Overbought zone and are diving straight to the 11.96 - 18.92 level in the Oversold territory. Bearish Momentum is completely dominating this downward swing.
RECOMMENDATIONS:
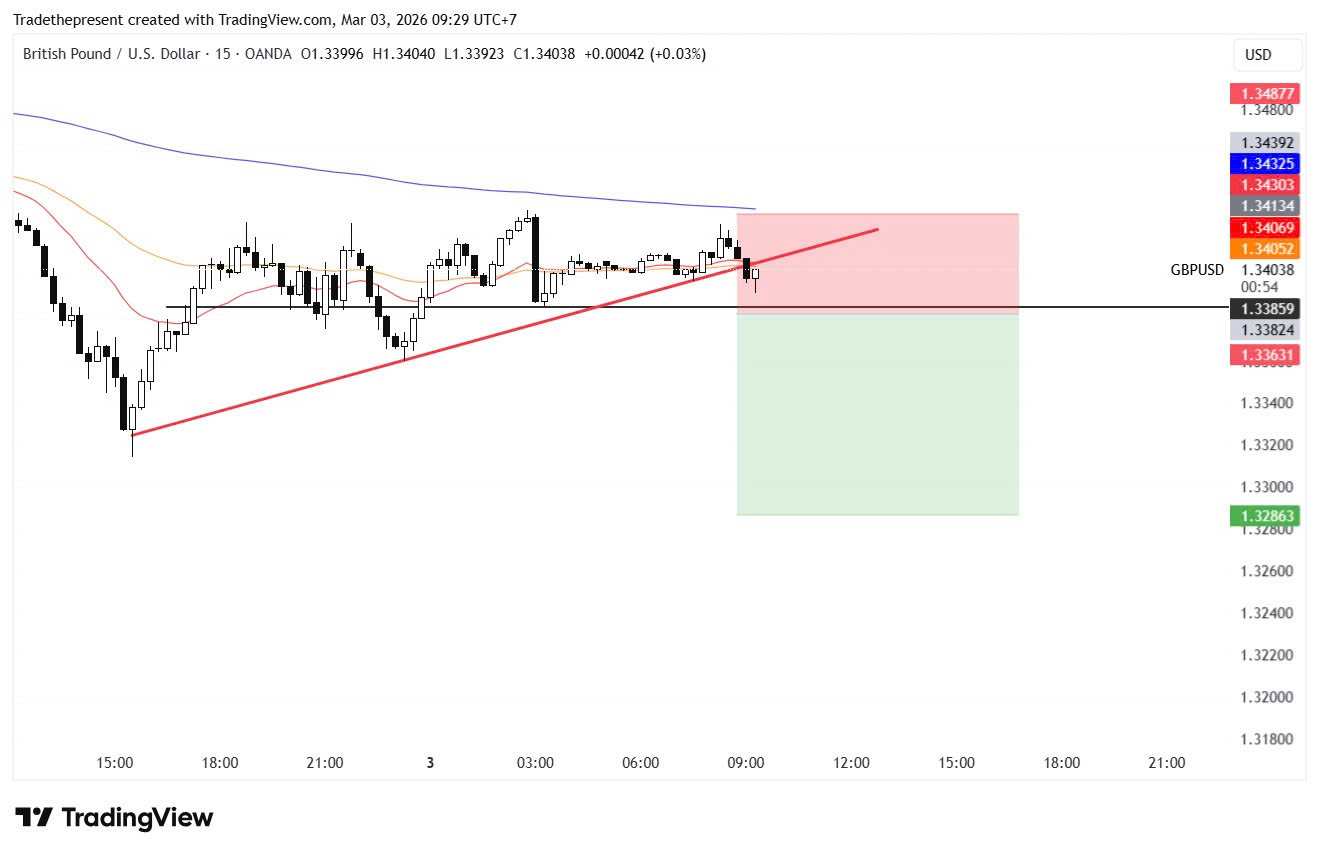
1. GBP/USD:
-
Sell Stop: 1.33800
-
Stop Loss: 1.34300
-
Take Profit: 1.32800
2. BTC:
-
Sell: 68,377
-
Stop Loss: 70,691
-
Take Profit: 65,000
NOTABLE EVENTS TODAY: No significant news.
DISCLAIMER:
-
The above analysis represents the personal views of analyst Leon from Lotus and does not constitute a basis for actual market participation.
-
Lotus only provides technical trading analysis and trading knowledge training for students.
-
Lotus does not represent any securities company or asset management firm.
-
Lotus does not accept capital management for students.


