 Lotus Institute


News
Lotus Institute

Market Review March 02: Gold’s Breakaway Gap vs. Bitcoin’s Complex Correction
Release Time: 10:00 AM, March 02, 2026 Analyst: Mr. Loki
MARKET OVERVIEW
1. Stock Market:
Vietnam Market: The VN-Index is experiencing increased hesitation as it approaches the 1,900 mark, evidenced by a Doji Star pattern and improved liquidity, signaling profit-taking pressure at higher levels. The recent rally was mainly driven by mid-cap and small-cap stocks, characterized by high volatility and short-term risks. The market is expected to test the 1,860–1,920 range before establishing a clearer trend.
US Market: In the Feb 27 session, Wall Street faced heavy selling pressure due to geopolitical concerns, hot inflation, and rising risks in the tech sector. Major indices declined simultaneously: S&P 500 fell ~0.4% to ~6,879; Nasdaq Composite dropped ~0.9% to ~22,668; Dow Jones fell ~1.1% to ~48,978. The Russell 2000 recorded the sharpest drop (~1.7%). This marked the steepest February decline in a year as "risk-off" sentiment spread.
2. Foreign Exchange (Forex):
USD/JPY: Main trend is sideways. Daily Resistance: 156.800; Daily Support: 155.500. Consider a short position if price breaks below the daily support.
AUD/USD: Main trend is bearish. Daily Resistance: 0.77500; Daily Support: 0.76700. Consider a short position if price breaks below the daily support.
3. Gold:
Action & Structure: Gold saw aggressive price action this morning with a Breakaway Gap, surging from the 5,280 consolidation zone to a peak of 5,380, currently retracing slightly around $5,351. Breaking out of the Darvas Box (5,130 - 5,280) with a large gap indicates a strong catalyst (large capital inflow or black swan event), causing a massive short squeeze.
Momentum: The Triple Stochastic indicator is pegged in the Overbought zone (above 80). In this "Runaway Gap" phase, the high reading confirms extreme Bullish Momentum rather than a reversal signal.
4. Oil:
XTI/USD: Main trend is sideways. Resistance: 75.10; Support: 63.70. Consider a short position if price breaks below support.
5. Bitcoin:
Action & Structure: Contrasting with Gold, Bitcoin is in a Complex Correction. After failing to test the supply zone around 69,000, price has made lower highs, currently trading near $66,348.
Momentum: Triple Stochastic signal lines are heading down toward the Oversold zone (below 20). No momentum divergence has appeared yet, suggesting short-term selling pressure still outweighs demand.
RECOMMENDATIONS:
EUR/USD: Sell Stop at 1.17500 | SL: 1.18300 | TP: 1.16000
BTC: Buy Stop at 67,500 | SL: 65,500 | TP: 70,790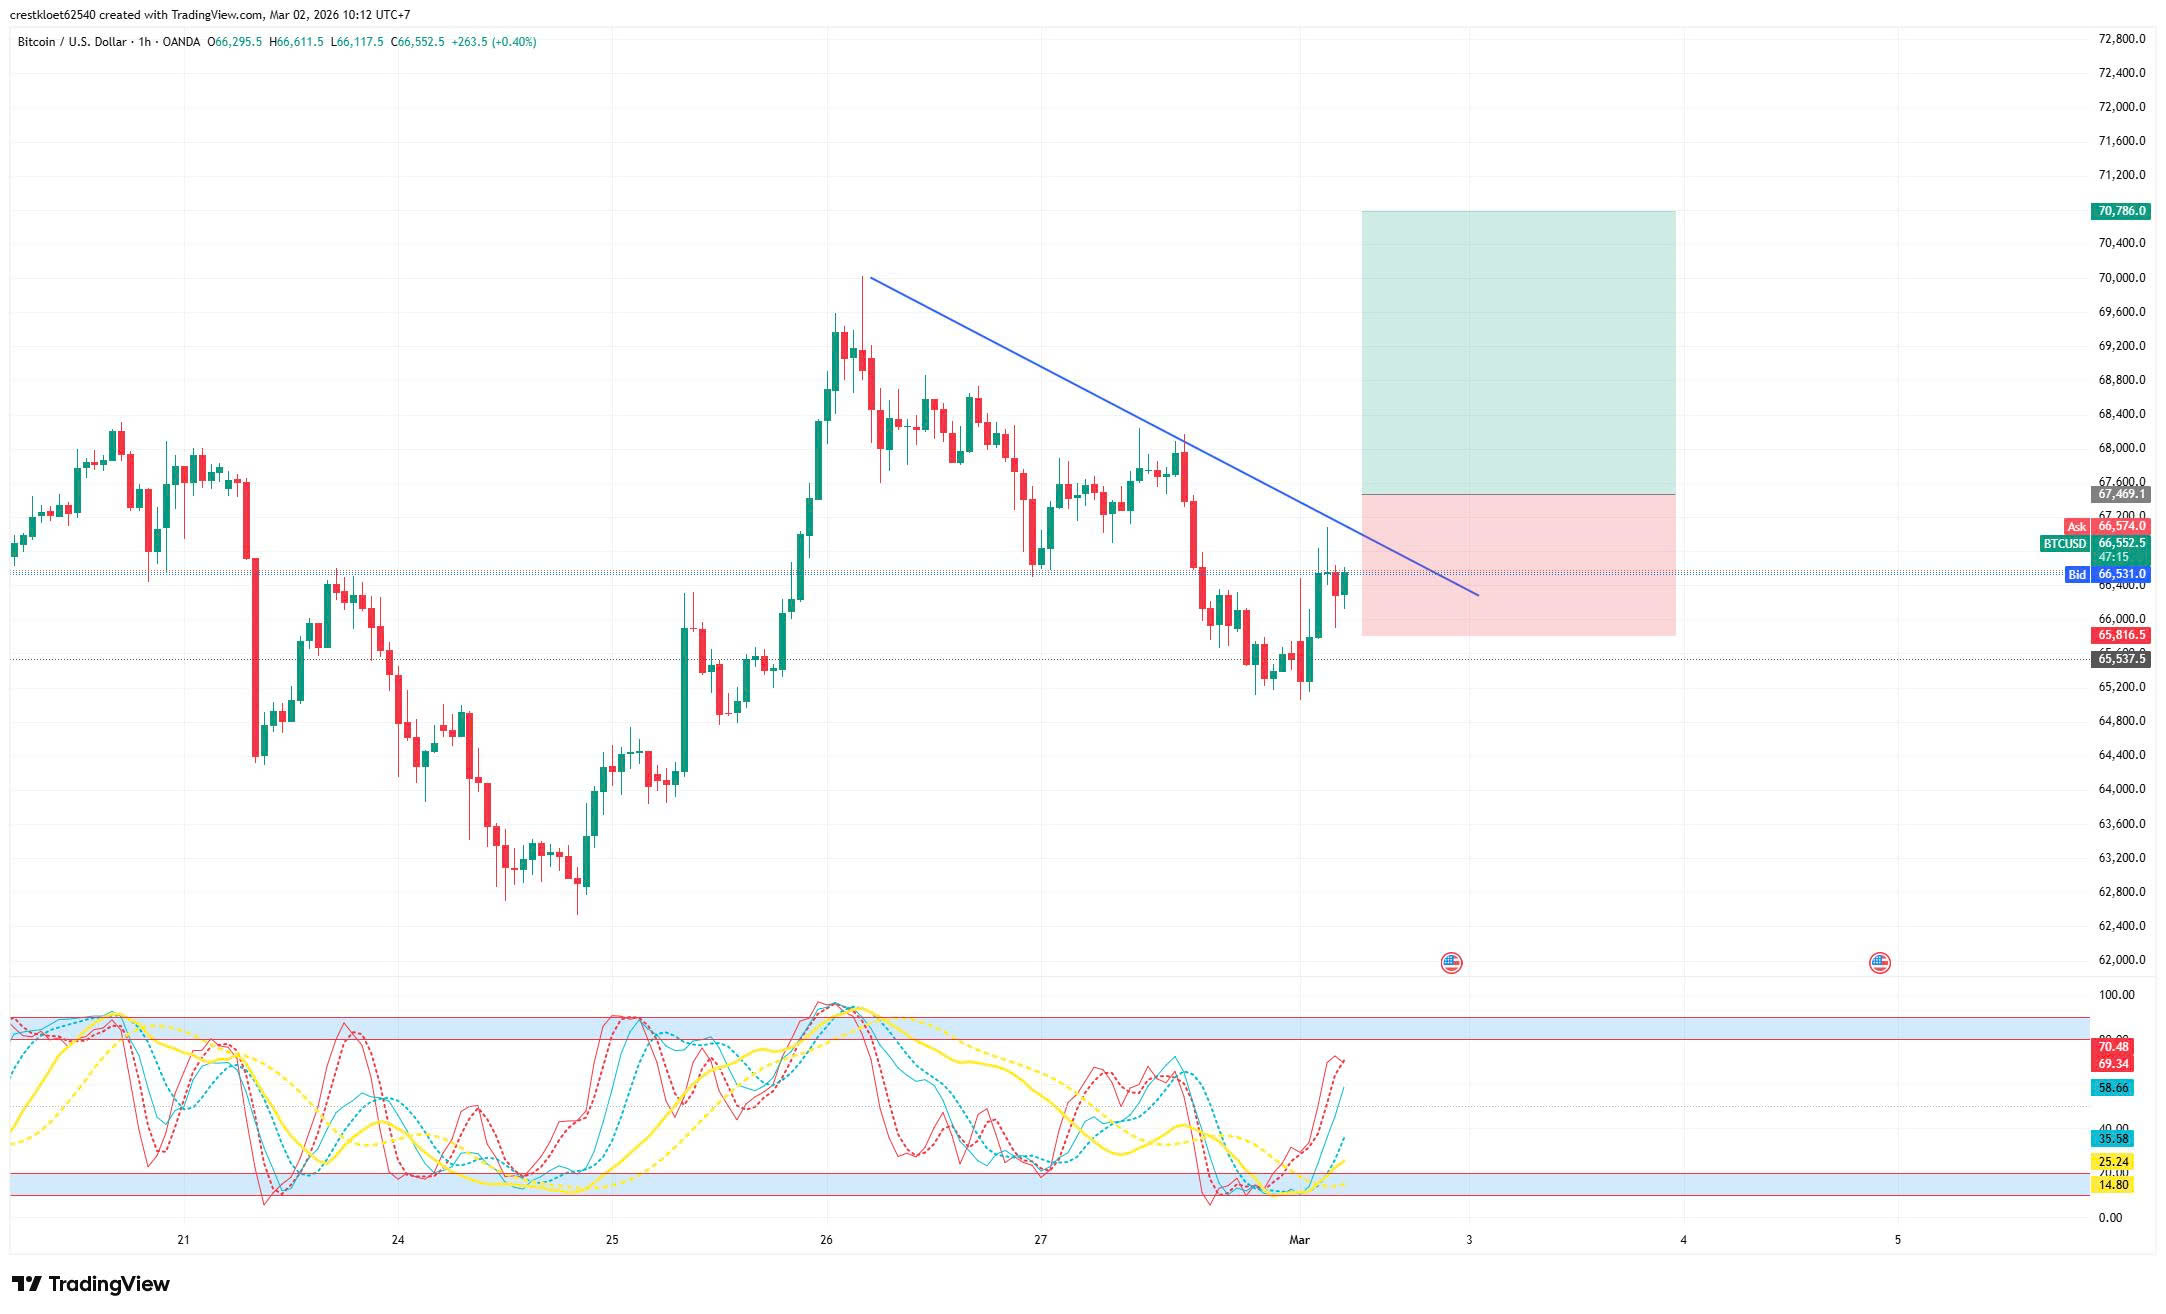
TODAY’S KEY EVENTS (10:00 PM):
ISM Manufacturing PMI: Actual: 51.7 | Previous: 52.6
ISM Manufacturing Prices: Actual: 60.6 | Previous: 59.0
DISCLAIMER:
The above comments represent the personal views of Analyst Loki from Lotus and do not constitute a basis for actual market participation.
Lotus only provides technical analysis and trading knowledge training for students.
Lotus does not represent any securities company or asset management firm.
Lotus does not manage student funds.


