 Lotus Institute


News
Lotus Institute

Market Feb 26: BTC Awaits Retest, Gold Stalls
Release Time: 10:00 AM, February 26, 2026 Issuer: Mr. Loki
MARKET OVERVIEW 1. Stock Market:
Vietnam Market: The market failed in its attempt to gain points under increasing profit-taking pressure, retreating to around 1,860 points, with rising liquidity indicating an expanding supply. The pressure became evident as the index entered the 1,860–1,920 point zone – the short-term peak area of January 2026. Although the tug-of-war state may prolong, the market is expected to find support upon correction and continue testing supply and demand in this zone.
US Market: In the February 25 session, the US market closed in the green as concerns over AI investment costs and tech risks temporarily subsided, improving investor sentiment. The S&P 500 rose about 0.8% to ~6,946 points, the Nasdaq Composite led with a +1.2% gain to ~23,152 points, and the Dow Jones increased ~0.6% to ~49,482 points, driven by major tech stocks like Nvidia ahead of its positive earnings report released after hours.
2. Foreign Exchange
EUR/USD: The prevailing trend is bearish. Daily resistance is at 1.18360, daily support is at 1.17400. You can enter a short position when the price breaks the daily support zone.
AUD/USD: The prevailing trend is bullish. Daily resistance is at 0.71100, daily support is at 0.70100. You can enter a long position when the price breaks the daily resistance zone.
3. Gold:
Movement: Gold is currently trading around $5,188, stalling after recovering from the bottom. Looking at the overall picture on the H4 timeframe, Gold is no longer maintaining a "Parabolic" state (steep rise/fall) but has transitioned into a Consolidation phase within a wide range.
Structure & Momentum: Although the price structure is still struggling to create Higher Lows, momentum is showing weakness. Specifically, the Stochastic indicator is showing signs of crossing down from the Overbought zone (around 81.12 and 79.22).
4. Oil:
XTI/USD: The prevailing trend is sideways. Daily resistance is at 66.40, daily support is at 65.20. You can enter a short position when the price breaks the daily support zone.
5. Bitcoin:
Movement: Bitcoin is trading around $67,972, right at the boundary of a critical resistance zone (purple box).
Setup: The H4 chart is displaying a textbook Trading Setup. The price has successfully broken out of the descending Trendline (blue diagonal line). However, instead of a vertical surge, the outlined scenario (via the blue arrow) suggests the price will have a Retest of the confluent support zone below before bouncing back towards the target of $72,809.8.
RECOMMENDATION:
USD/CAD – Sell Stop at 1.36400, Stop Loss at 1.37000, Take Profit at 1.35000.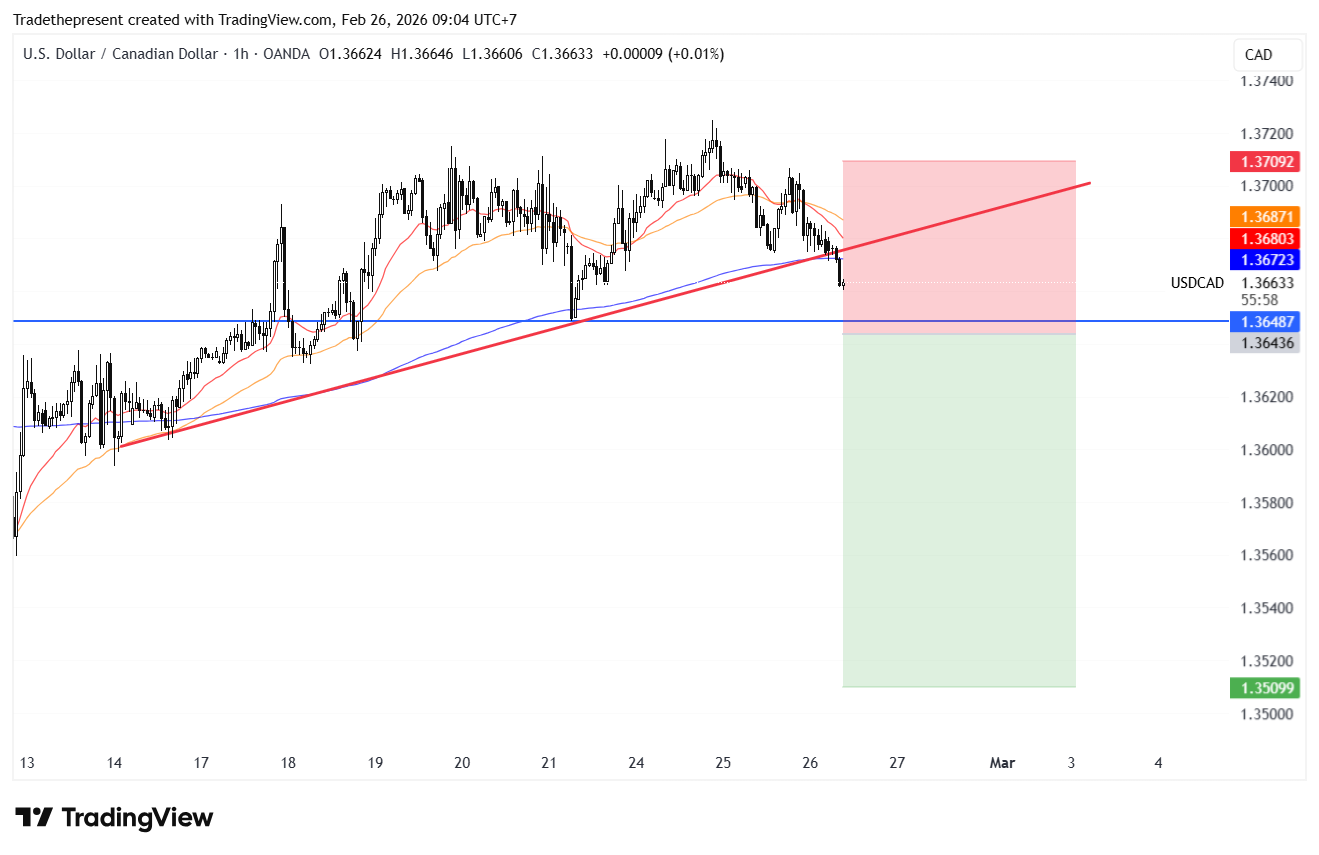
BTC – Buy Limit at 67,200, Stop Loss at 65,000, Take Profit at 73,000.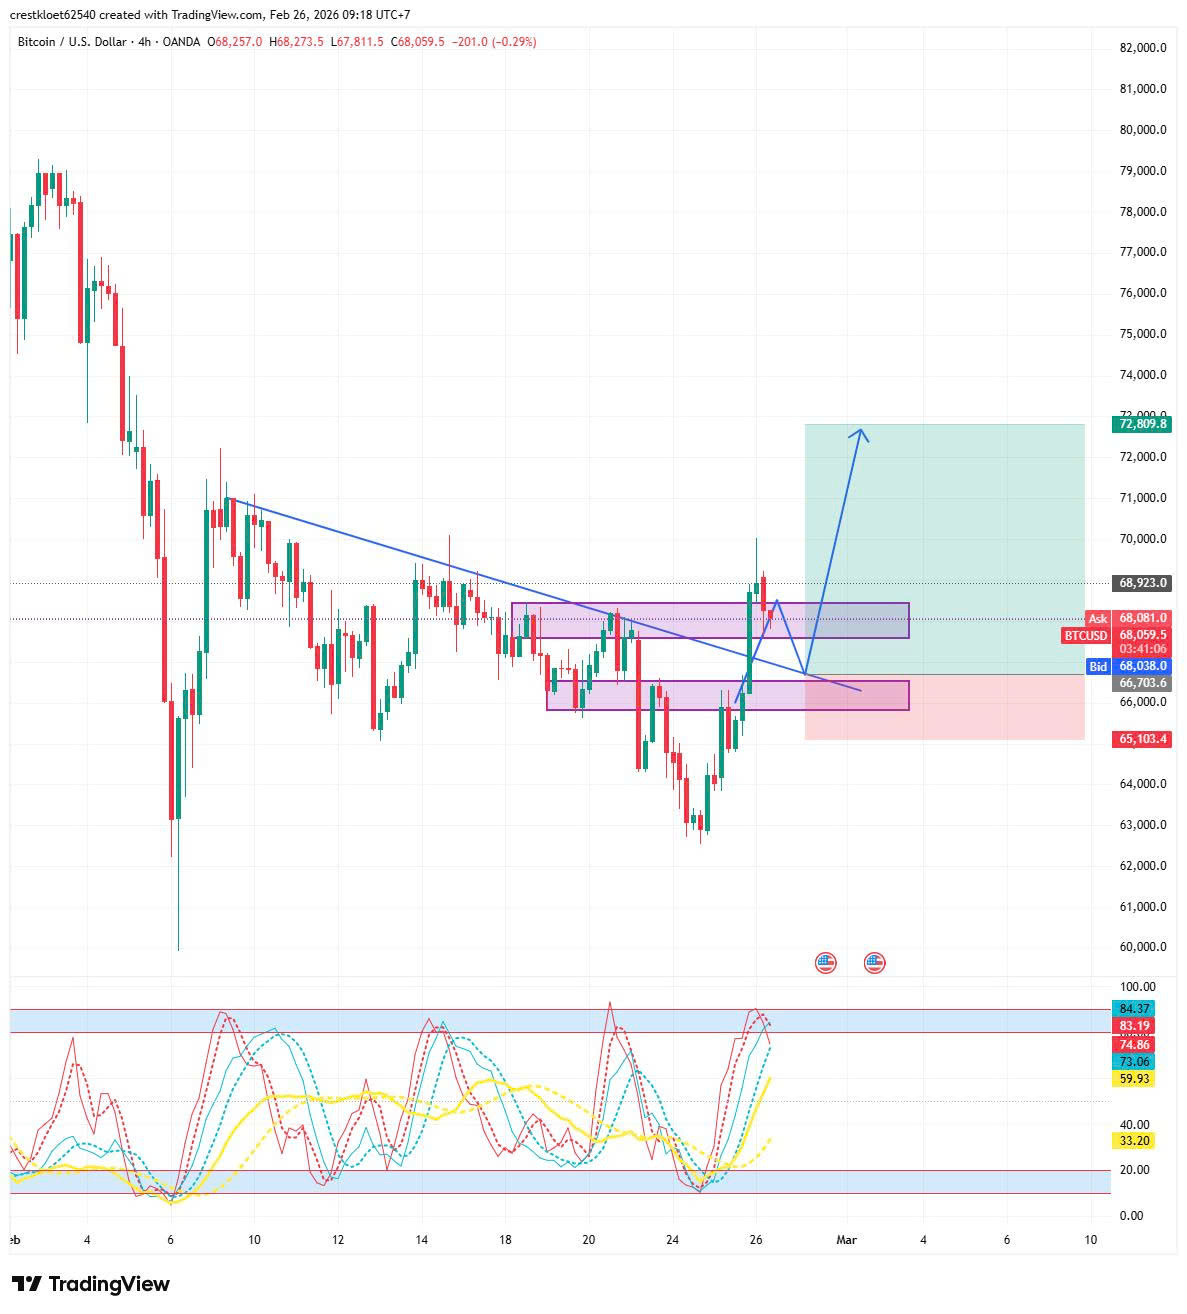
NOTABLE EVENTS TODAY:
Time: 8:30 PM
Affected Currency: USD (US Dollar)
Event: Unemployment Claims
Figures: 217K / 206K
DISCLAIMER
The above assessments represent solely the personal views of analyst Loki from Lotus and do not constitute a basis for actual market participation.
Lotus only provides trading technical analysis and trading education for students.
Lotus does not represent any securities company or asset management firm.
Lotus does not manage funds for students.


