 Lotus Institute


News
Lotus Institute

BITCOIN IN "FREE FALL" TO $62K - GOLD FAILS AT $5,000: HAS THE "GO" REVERSAL SIGNAL APPEARED?
Release Time: 10:00, February 06, 2026 Issuer: Mr. Leon
MARKET OVERVIEW
1. Stock Market:
-
Vietnam Market: The market is still under correction pressure and has not been able to return above the 1,800 points mark, but the downward momentum is temporarily halted around the MA(50) region (~1,780 points). Declining liquidity indicates that selling pressure is not yet significant, although cash flow remains quite cautious. Being continuously blocked at the 1,800 mark increases short-term risk; however, if the MA(50) continues to act as support, the market still has a chance to recover and form a re-accumulation zone; conversely, losing this zone could extend the correction phase.
-
US Market: In the Feb 5 session, Wall Street faced a widespread sell-off, particularly in technology stocks and risk assets. The S&P 500 fell about 1.2% to ~6,798 points, the Dow Jones Industrial Average retreated nearly 1.2% to ~48,909 points, while the Nasdaq Composite slumped ~1.6% to ~22,540 points amidst concerns over AI investment costs and weak labor data. This session continued the negative trend as many major asset classes corrected simultaneously, reflecting increased caution.
2. Forex:
-
EUR/USD: Dominant trend is Bearish. Daily resistance: 1.18200; Daily support: 1.17600. Consider Short positions if price breaks the daily support zone.
-
USD/CHF: Dominant trend is Sideways. Daily resistance: 0.77700; Daily support: 0.77400. Consider Short positions if price breaks the daily support zone.
3. Gold:
-
Performance: The "Phoenix Rebirth" scenario on Feb 04 failed miserably. Gold prices could not hold the $5,000 mark and turned to drop deeply, currently trading around $4,796.
-
Structure: The Trend Ribbon has turned back to Red and is sloping downwards, confirming that a short-term Bearish trend is dominating. Price is continuously creating Lower Highs. However, at the nearest bottom, a series of "GO" signals (green triangles) from the Decycler Trident system have appeared.
4. Oil:
-
XTI/USD: Dominant trend is Bearish. Daily resistance: 64.70; Daily support: 62.30. Consider Short positions if price breaks the daily support zone.
5. Bitcoin:
-
Performance: Looking at the BTC chart right now is truly "heartbreaking." Price has experienced a Waterfall decline, falling vertically from the $76k zone (on Feb 04) to the bottom of $62,000 before slightly recovering to the current $64,369.
-
Structure: Capitulation (panic selling) occurred extremely strongly, with consecutive long red candles piercing through all supports. However, similar to Gold, at this deep bottom, the system has also flashed a "GO" signal (green triangle) warning of a potential reversal.
RECOMMENDATIONS:
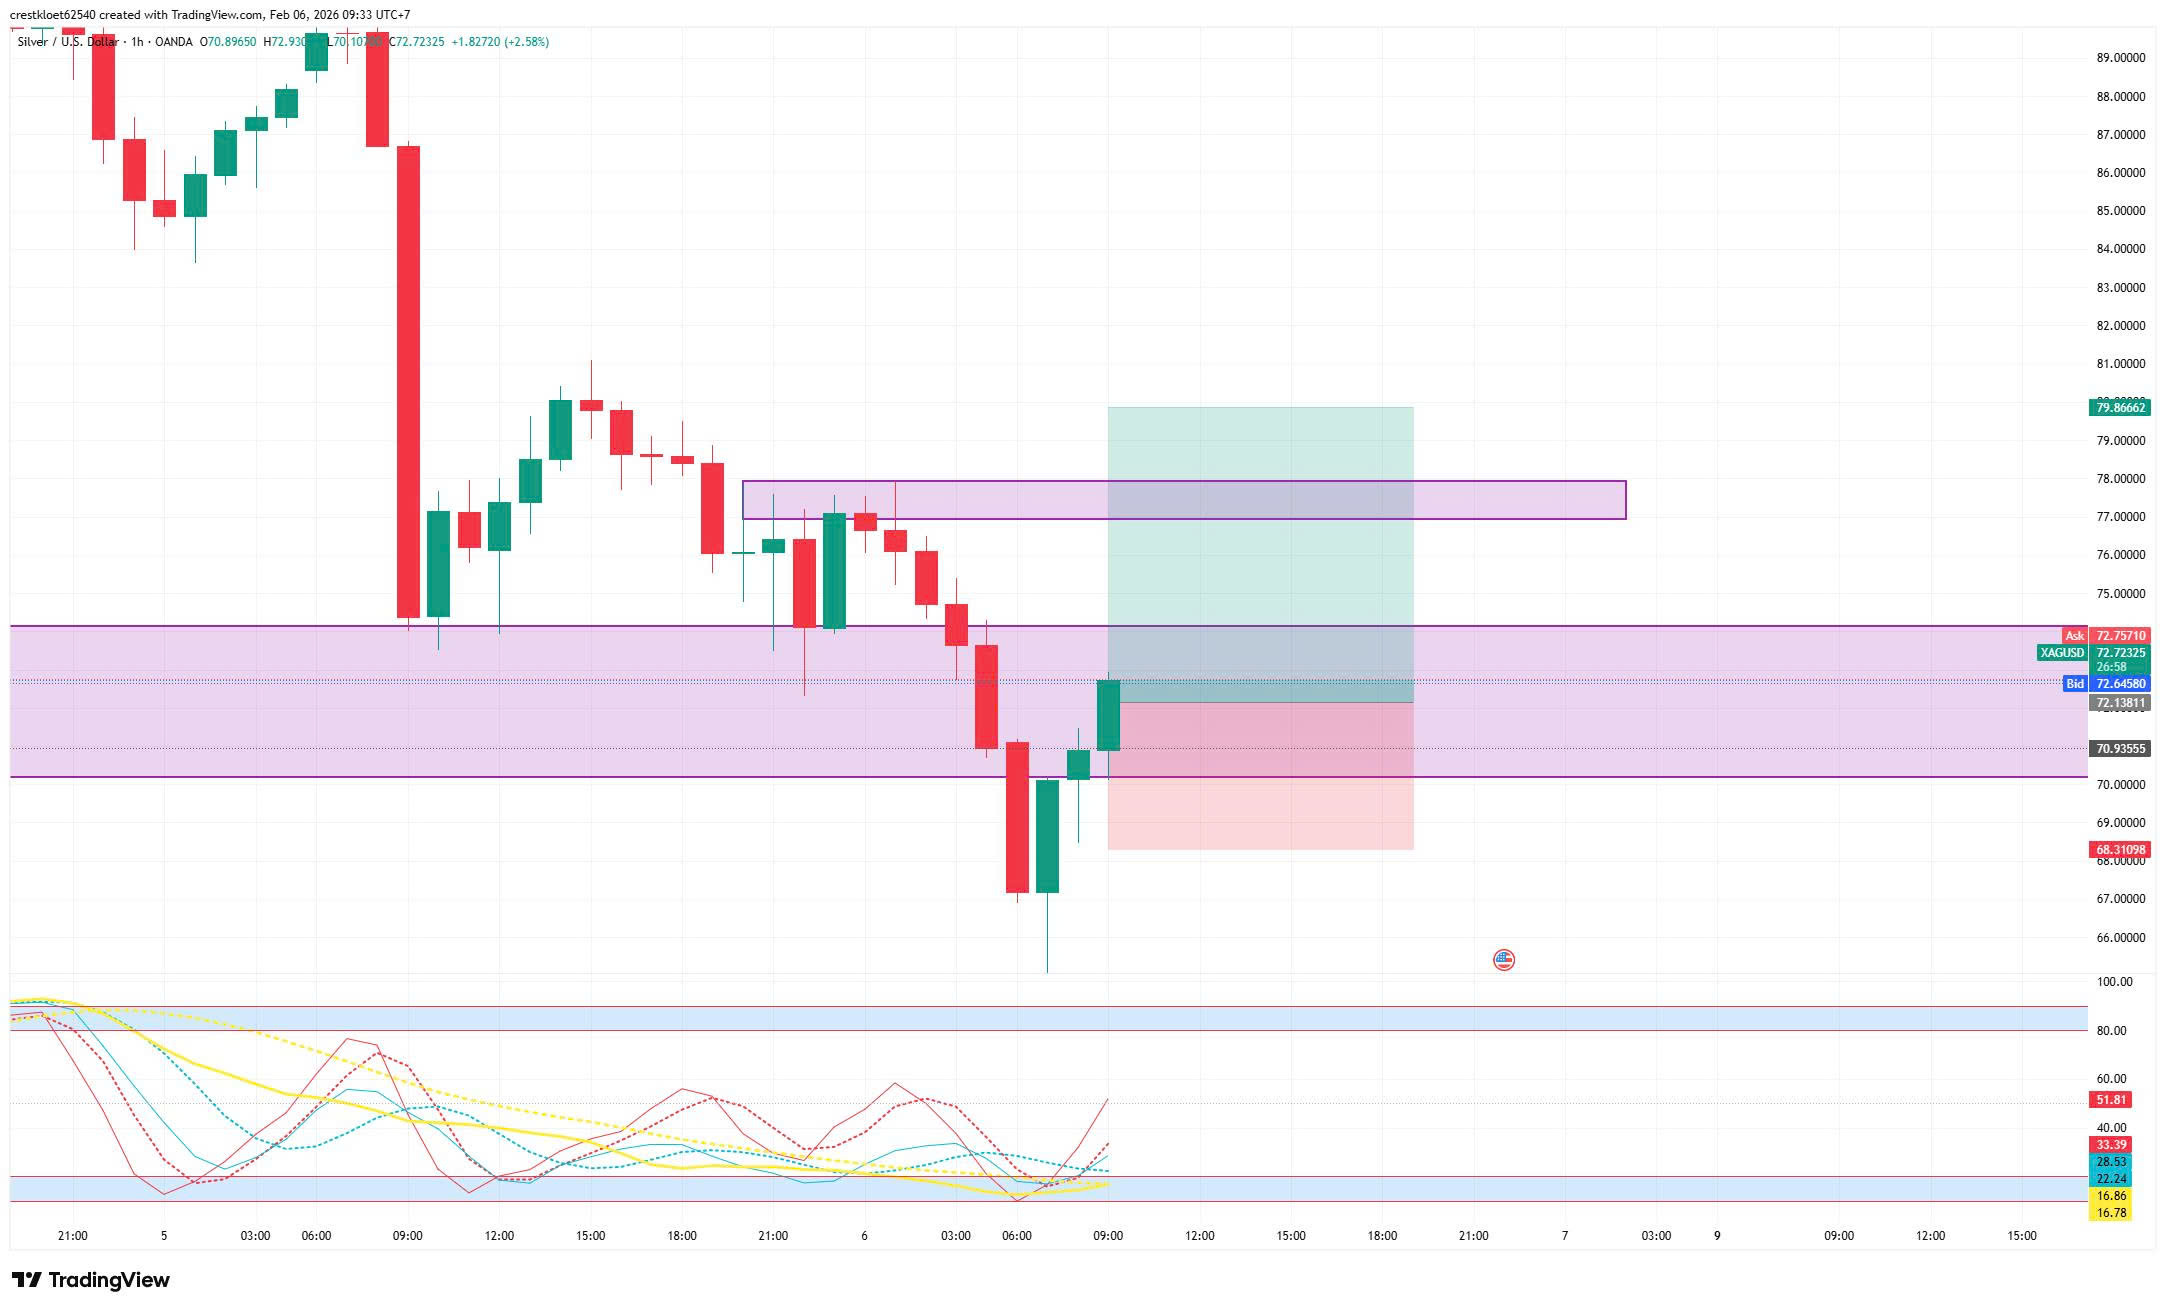
1. Silver:
-
Buy Entry: 72.88
-
Stop Loss: 68.31
-
Take Profit: 79.86
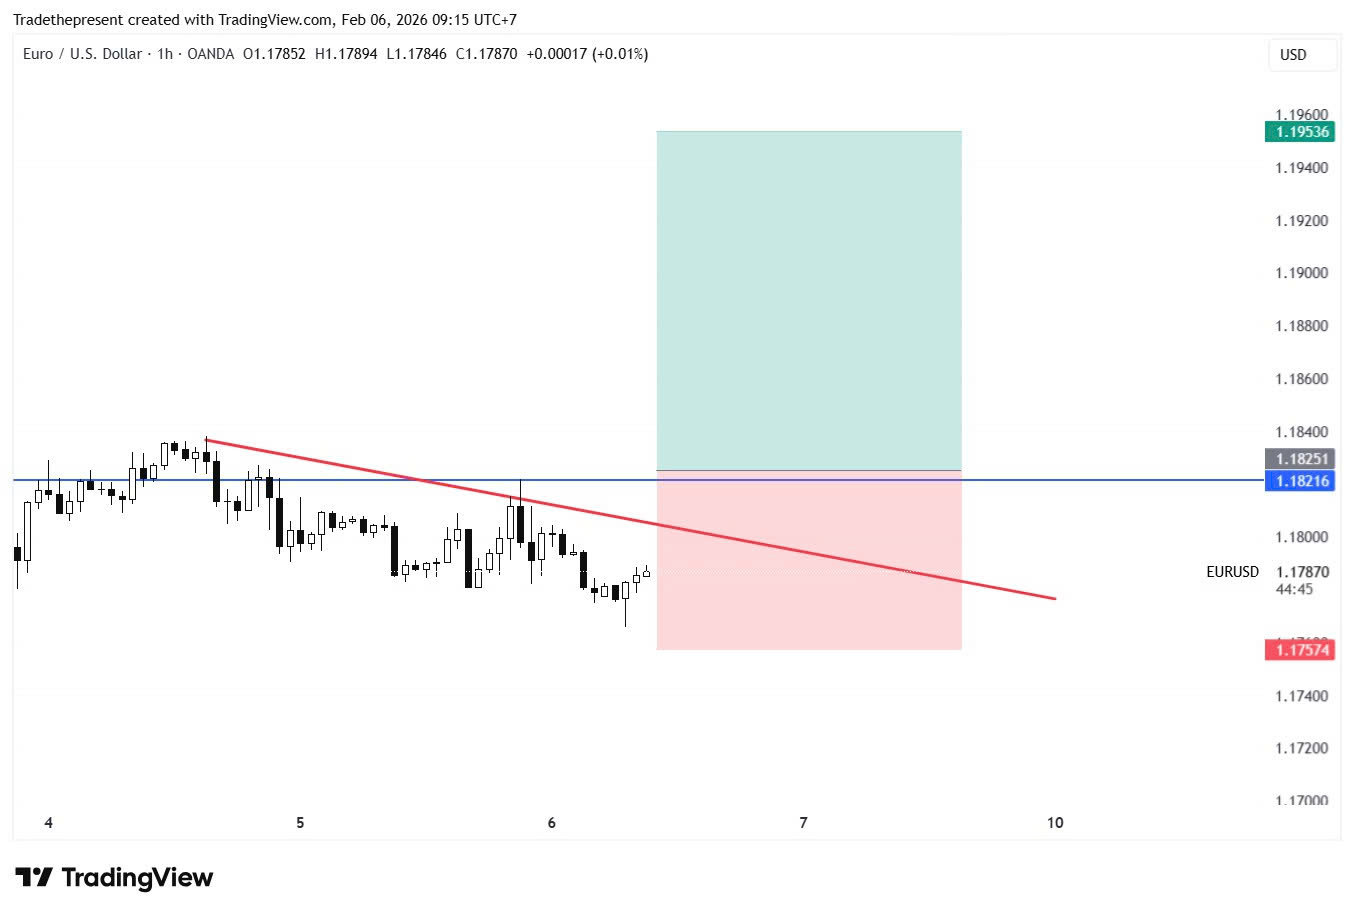
2. EUR/USD:
-
Buy Stop: 1.18200
-
Stop Loss: 1.17500
-
Take Profit: 1.19500
NOTABLE EVENTS TODAY: 
DISCLAIMER:
-
The above analysis represents the personal views of analyst Leon from Lotus and does not constitute a basis for actual market participation.
-
Lotus only provides technical trading analysis and trading knowledge training for students.
-
Lotus does not represent any securities company or asset management firm.
-
Lotus does not accept capital management for students.


")