 Lotus Institute


News
Lotus Institute

GOLD OFFICIALLY BREAKS $5,000 TRENDLINE - VN-INDEX WARNS OF A "BULL TRAP": SHORT SELLING STRATEGY
Release Time: 10:00, March 16, 2026 Issuer: Mr. Leon
MARKET OVERVIEW
1. Stock Market:
-
Vietnam Market:
-
Price Structure: VN-Index is painting a rather negative picture. After a deep plunge from the 1,900 zone down to near 1,640, the index had a technical Relief Rally to the 1,720 zone but immediately weakened and is heading back down to the 1,689 level.
-
Momentum: The recent bounce was not accompanied by an improvement in the MA structure (the ribbon remains deep red). Notably, the Stochastic indicator, after hitting the overbought zone, has sharply angled downwards.
-
-
US Market (US100):
-
Price Structure: US100 is in a complex zig-zag corrective structure. The price fell rapidly and is currently stalling around the $24,476 mark, forming long-tailed candles indicating buying demand at this zone.
-
Momentum: The Stochastic indicator is hooking up from the deep oversold zone (below 20). This signals that short-term selling pressure is temporarily exhausted, paving the way for a technical bounce.
-
2. Forex:
-
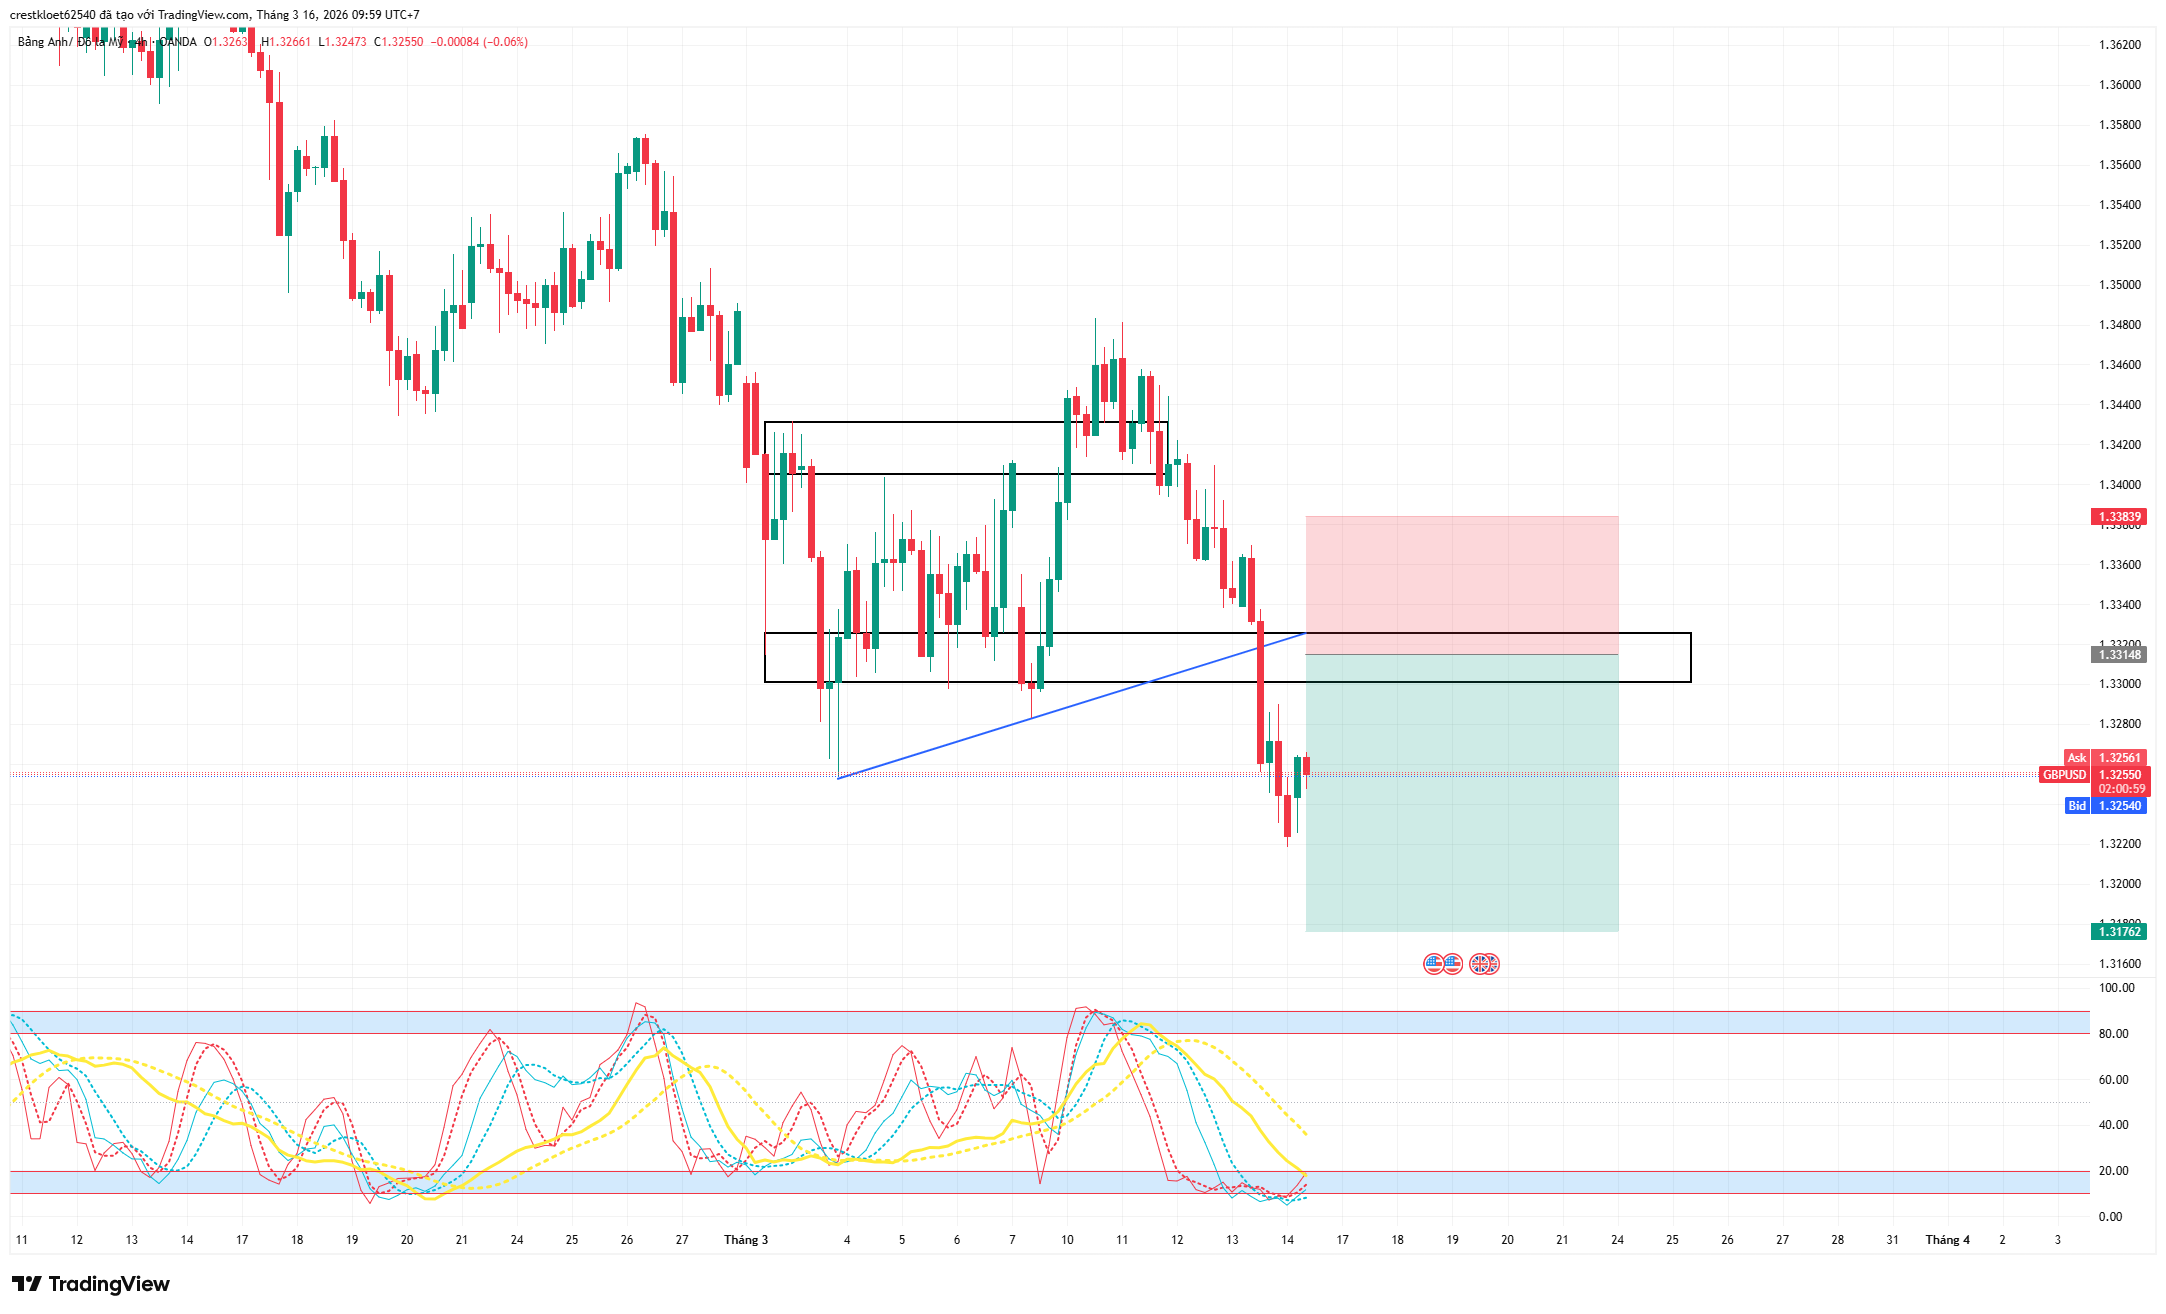
GBP/USD: Dominant trend is Bearish. Daily resistance: 1.13400; Daily support: 1.33000. Consider Short positions when the price breaks the daily support zone.
-
USD/CHF: Dominant trend is Bullish. Daily resistance: 0.78400; Daily support: 0.77800. Consider Long positions when the price breaks the daily resistance zone.
3. Gold:
-
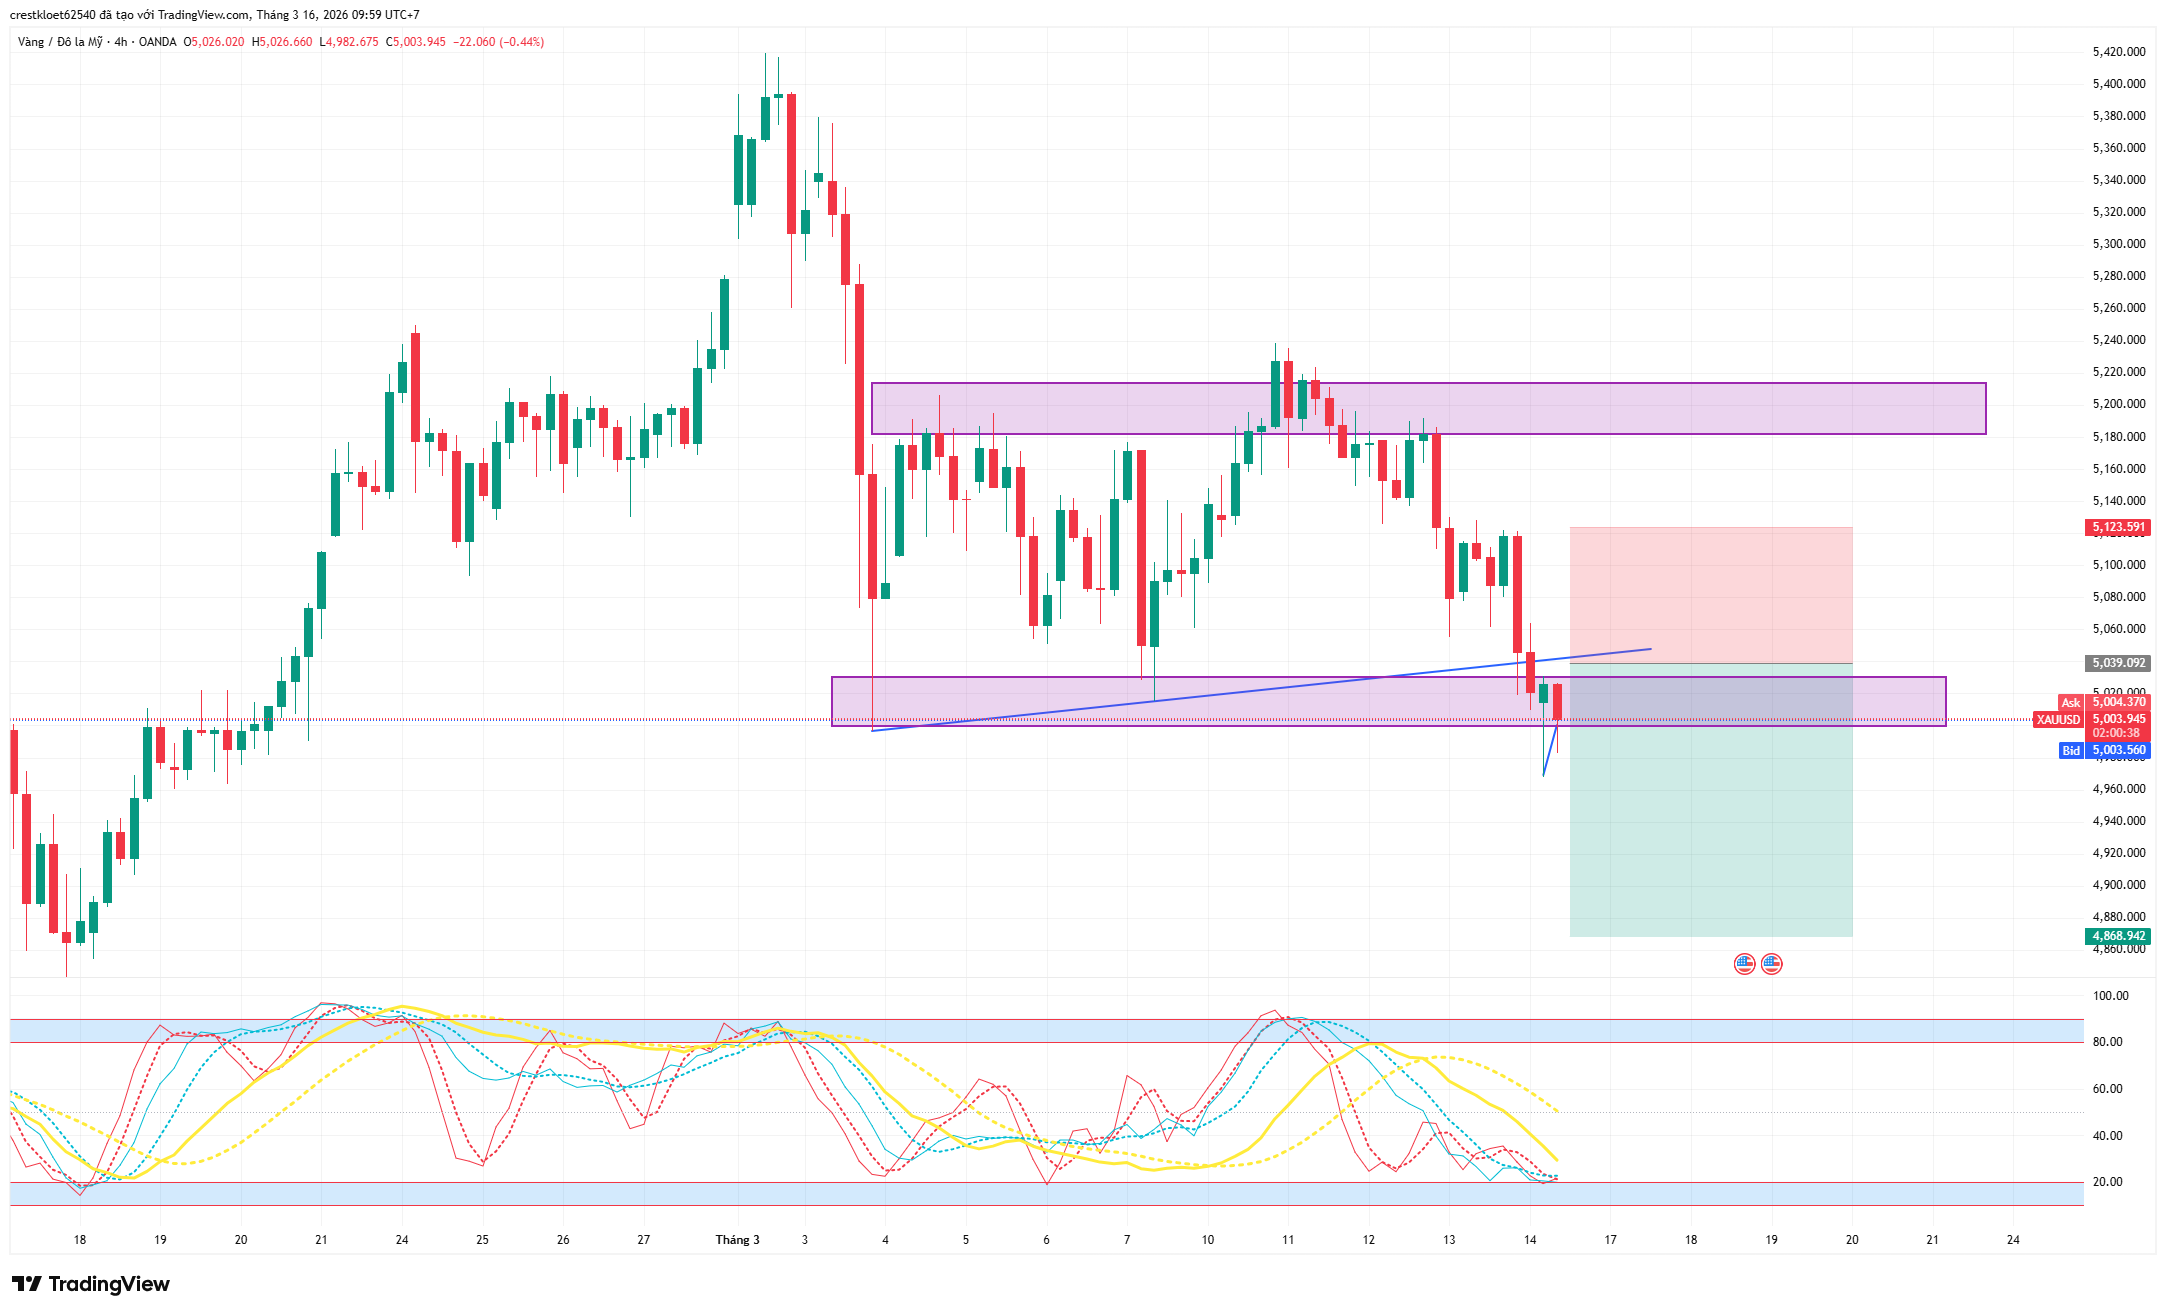
Price Structure: The Gold chart shows comprehensive weakness. The critical technical point is that the price has officially broken the diagonal support Trendline (blue line) extending from previous bottoms. Currently, the H1 candle is plunging and testing the psychological support of $5,000 (currently at $5,001).
-
Momentum: The MA ribbon is expanding its downward crossing angle very sharply, reflecting completely overwhelming supply pressure.
4. Oil:
-
Price Structure: After a drop that "halved the bullish momentum" from the Parabolic peak of $114 to the $80 zone, Oil has found equilibrium and is in a Recovery phase forming ascending steps. The H1 chart shows the price continuously creating Higher Highs and Higher Lows, while maintaining its structure above the blue support ribbon, currently trading around the $97.548 mark.
-
Momentum: Although the price structure is positive, the momentum indicator is flashing a warning signal. The signal lines have hit the ceiling of the extreme Overbought zone (near 100) and are starting to angle downwards.
5. Bitcoin:
-
Price Structure: Contrary to Gold, BTC maintains an extremely resilient Uptrend structure. After a dip, the price quickly snapped back in a V-shape and is currently moving sideways in consolidation around the $72,520 mark.
-
Momentum: The MA ribbon remains green and pointing upwards, providing good support for the price. The Stochastic indicator is in the overbought zone and showing signs of crossing down. However, in a strong uptrend, this signal usually just represents a sideways consolidation phase to shake out chasing Long orders, rather than a reversal.
RECOMMENDATIONS:
1. GOLD:
-
Sell: 5039
-
Stop Loss: 5123
-
Take Profit: 4868
2. GBP/USD:
-
Sell: 1.33148
-
Stop Loss: 1.33839
-
Take Profit: 1.31762
NOTABLE EVENTS TODAY: No significant news.
DISCLAIMER:
-
The above analysis represents the personal views of analyst Leon from Lotus and does not constitute a basis for actual market participation.
-
Lotus only provides technical trading analysis and trading knowledge training for students.
-
Lotus does not represent any securities company or asset management firm.
-
Lotus does not accept capital management for students.


