 Lotus Institute


News
Lotus Institute

Market Dec 19: Gold Hits Oversold Zone – Bitcoin "Breaks Net" to $85,500
Release Time: 10:00, December 19, 2025
Released by: Mr. Loki
MARKET OVERVIEW
1. Stock Market:
-
Vietnam Market: The market retreated during the session but showed a recovery toward the end of the day, forming a Hammer candle, which indicates that support demand is gradually appearing. Slightly lower liquidity reflects a cautious stance from both cash flow and supply after a period of high volatility. While overall sentiment remains wary, the Hammer signal near the MA100 suggests that technical support is effective as selling pressure temporarily weakens. With these signals, the market may recover in the near term to retest the resistance zone of 1,690–1,710 points.
-
US Market: On December 18, Wall Street surged following cooler-than-expected inflation data and positive earnings reports from the tech sector. The S&P 500 rose ~0.8% to ~6,774.8, the Nasdaq Composite jumped ~1.38% to ~23,006.4, and the Dow Jones edged up ~0.14% to ~47,951.9, ending its previous losing streak and reflecting optimism about further Fed rate cuts.
2. Foreign Exchange (Forex):
-
EUR/USD: Main trend is sideways. Daily resistance: 1.17500; Daily support: 1.17000. Consider long positions if the price breaks above the daily resistance.
-
GBP/USD: Main trend is sideways. Daily resistance: 1.34300; Daily support: 1.33500. Consider long positions if the price breaks above the daily resistance.
3. Gold: After a failed attempt to break the $4,370 zone, Gold reversed and is currently trading around $4,322. The Stochastic indicator at the bottom has reached the Oversold zone and is showing signs of a bullish crossover. This suggests that selling pressure may be exhausted and a technical recovery is imminent.
4. Oil:
-
XTI/USD: Main trend is sideways. Daily resistance: 56.50; Daily support: 55.90. Consider long positions if the price breaks above the daily resistance.
5. Bitcoin (BTC): BTC just experienced a sharp dump, breaking through the consolidation base and falling straight to the $85,580 area. Structure: A bearish trend is clearly confirmed as the price stays entirely below the EMA bands (yellow, green, and red lines are all pointing down). The long red candle indicates aggressive selling, with bulls showing almost no resistance. Danger Zone: Price is hovering near the previous support bottom of $85,300 - $85,500. This is the last stronghold; if this level breaks, BTC could trigger a panic sell to deeper levels.
RECOMMENDATION:
-
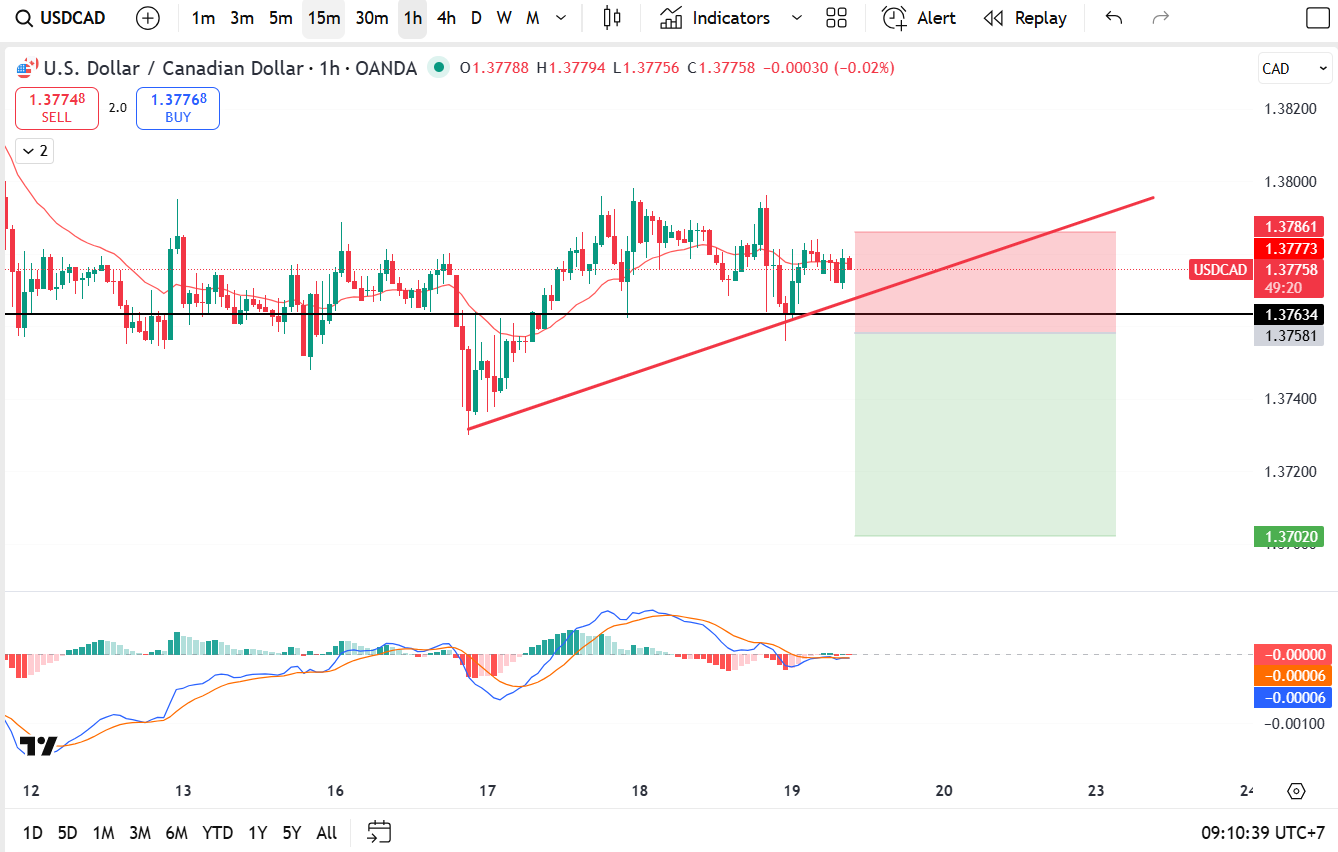
USD/CAD: Sell Stop at 1.37600, SL 1.37900, TP 1.37000.
KEY EVENTS TODAY:
-
JPY: BOJ Policy Rate (Forecast: <0.75% | Previous: <0.50%); Monetary Policy Statement; BOJ Press Conference (Tentative).
-
GBP (2:00 PM): Retail Sales m/m (Forecast: 0.3% | Previous: -1.1%).
-
CAD (8:30 PM): Core Retail Sales m/m (Forecast: 0.0%); Retail Sales m/m (Forecast: 0.0%).
-
USD (10:00 PM): Existing Home Sales (Forecast: 4.15M); Revised UoM Consumer Sentiment (Forecast: 53.5).
DISCLAIMER:
The above comments represent the personal views of analyst Loki from Lotus and do not constitute a basis for actual market participation.
Lotus only provides technical analysis and trading education.
Lotus does not represent any securities or asset management companies and does not manage student funds.


")
