 Lotus Institute


News
Lotus Institute

WALL STREET HITS HISTORIC HIGHS - GOLD FALLS FROM $4,630 PEAK: GOLDEN OPPORTUNITY TO BUY BITCOIN AT $91K?
Release Time: 10:00, January 13, 2026 Issuer: Mr. Leon
MARKET OVERVIEW
1. Stock Market:
-
Vietnam Market: The market continues its effort to rise and challenge the region near 1,900 points but is temporarily held back, forming a Star candle, indicating that profit-taking pressure is present as it approaches the resistance zone. Increased liquidity reflects a tug-of-war state; however, cash flow is more active in many stock groups with efforts to absorb supply. In this context, the market may continue to struggle but still has the opportunity to retest the 1,900 area. Supply-demand developments in this zone will determine the next trend.
-
US Market: In the Jan 09 session, Wall Street continued to record strong gains and set new historic highs as optimistic investor sentiment extended following previous concerns. The Dow Jones Industrial Average rose ~0.48% to ~49,504 points, the S&P 500 gained ~0.65% to ~6,966.3 points, and the Nasdaq Composite climbed ~0.81% to ~23,671 points—all closing at record levels. This development reflects that cash flow remains strong in technology and large-cap groups, reinforcing sustainable recovery signals in the short term.
2. Forex:
-
GBP/USD: Dominant trend is Bullish. Daily resistance: 1.34800; Daily support: 1.34600. Consider Short positions if price breaks the daily support zone.
-
USD/CHF: Dominant trend is Bearish. Daily resistance: 0.80000; Daily support: 0.79500. Consider Long positions if price breaks the daily resistance zone.
3. Gold:
-
Performance: After creating an impressive new peak at $4,630 (green price label at the top), Gold faced strong profit-taking pressure and is currently correcting to the $4,584 zone.
-
Structure: Price is returning to "check the health" at the short-term EMA support zone (yellow/green lines) around $4,577. This is a crucial buffer zone; if this level holds, the uptrend will continue.
4. Oil:
-
XTI/USD: Dominant trend is Bullish. Daily resistance: 59.90; Daily support: 58.50. Consider Long positions if price breaks the daily resistance zone.
5. Bitcoin:
-
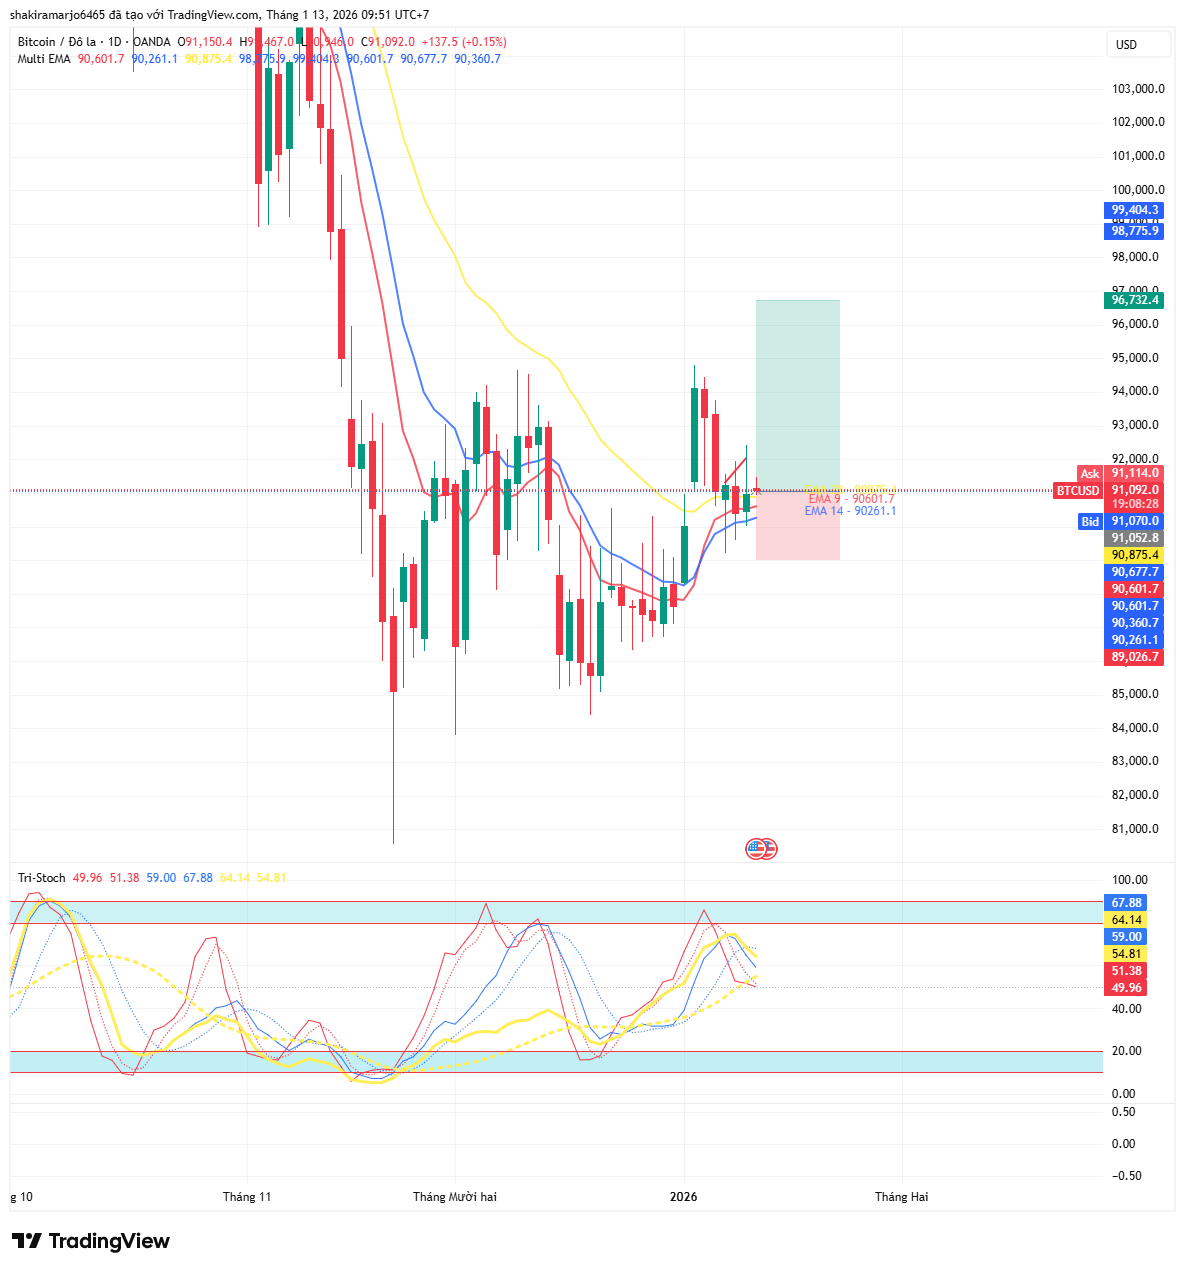
Performance: BTC is trading in a "sleepy" state around $91,191. The price is being suppressed by a bearish trendline (red diagonal line) acting as hard resistance overhead.
-
Structure: Price is moving Sideways and coiling around EMA lines, showing hesitation from both Bulls and Bears. BTC is compressing within a small triangle pattern, preparing for an upcoming Breakout.
RECOMMENDATIONS:
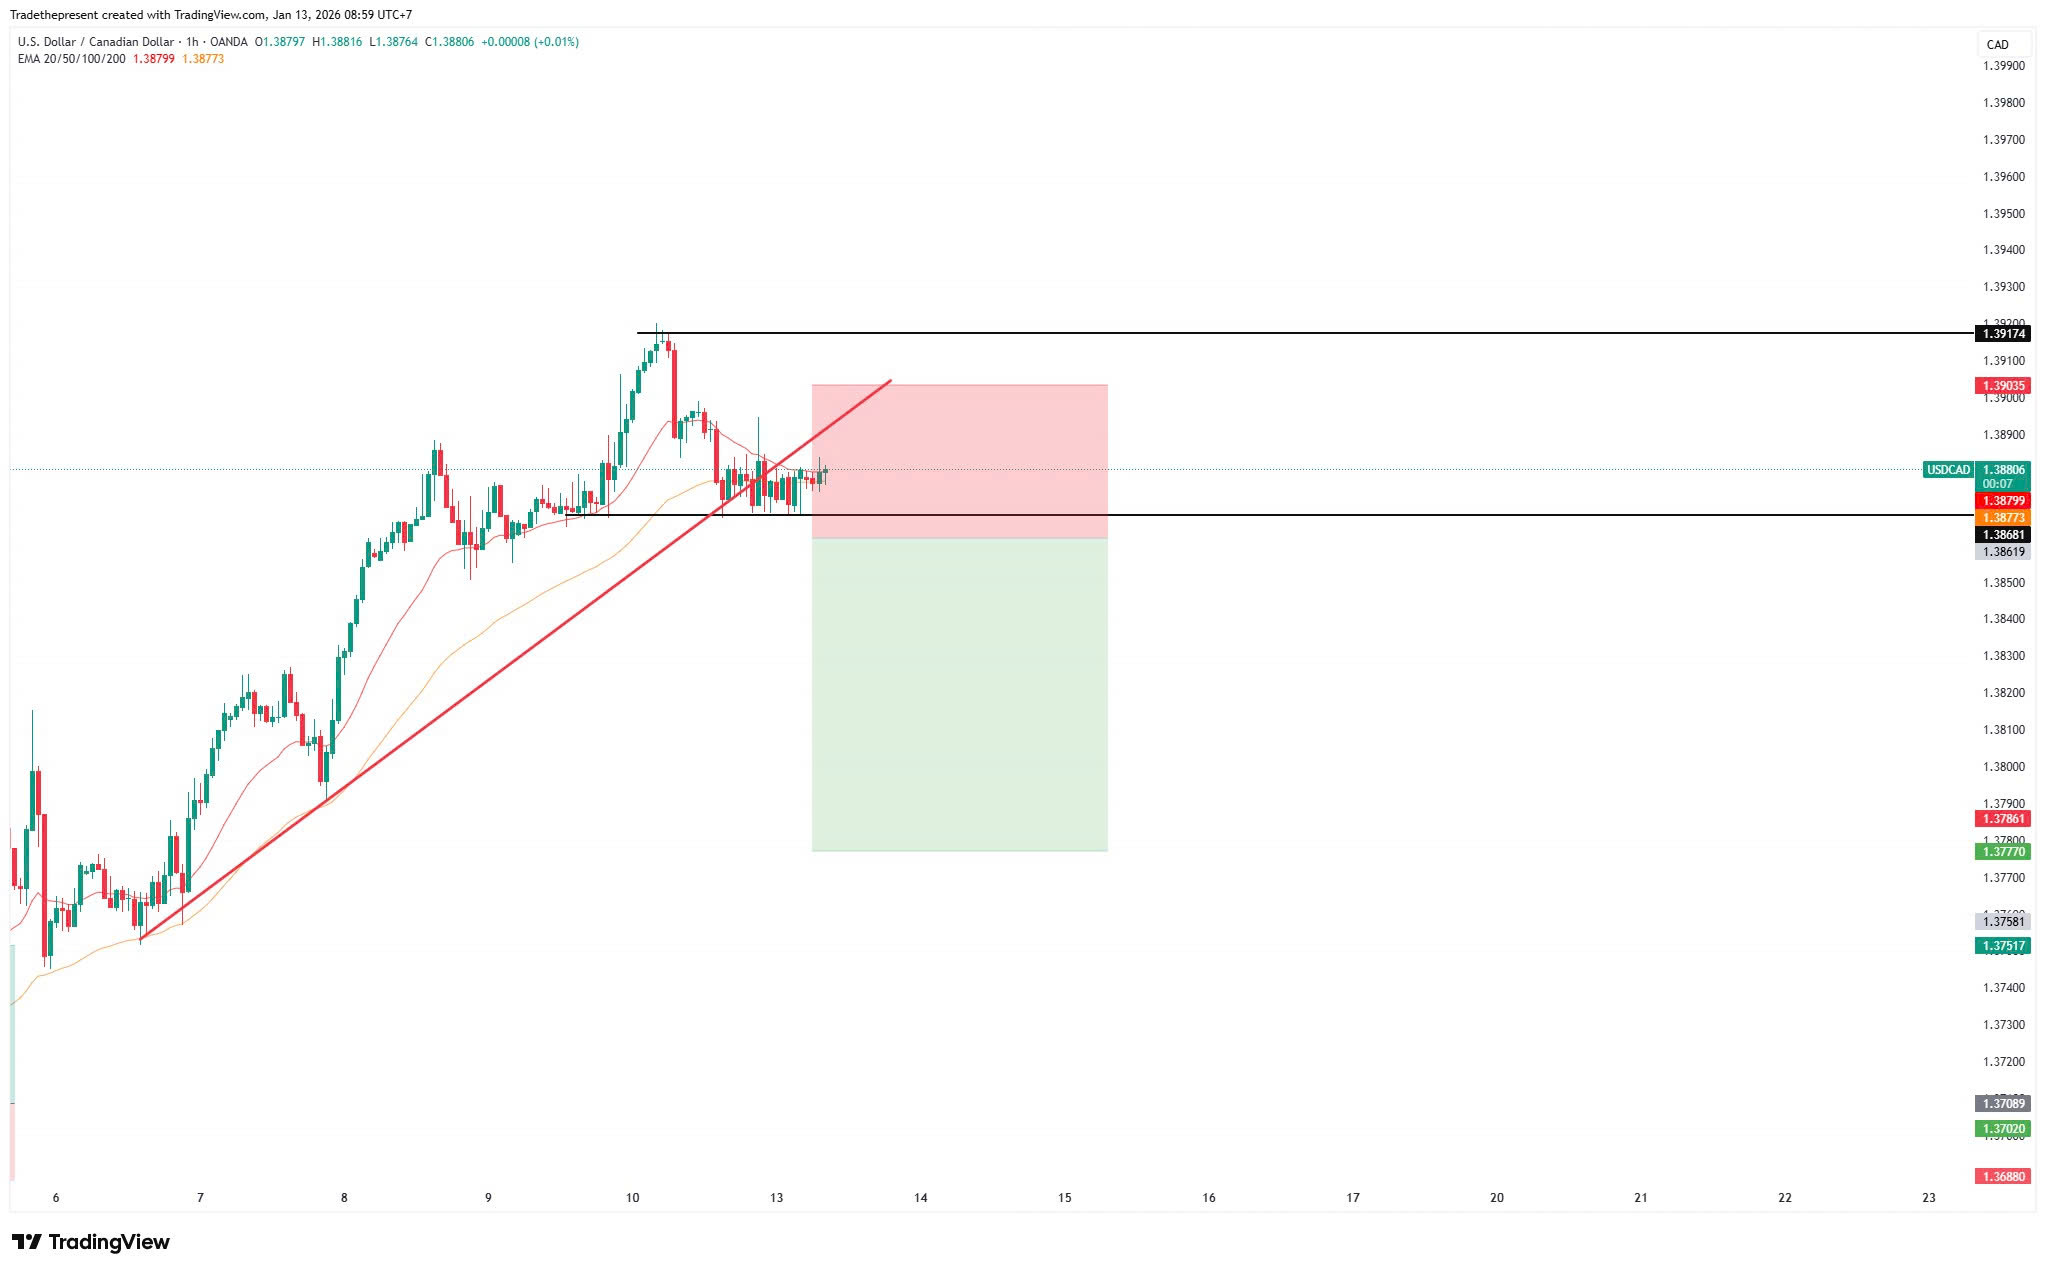
1. USD/CAD:
-
Sell Stop: 1.38600
-
Stop Loss: 1.39000
-
Take Profit: 1.37700
2. BTC:
-
Buy Entry: 91,000
-
Stop Loss: 89,000
-
Take Profit: 96,000
NOTABLE EVENTS TODAY: 
DISCLAIMER:
-
The above analysis represents the personal views of analyst Leon from Lotus and does not constitute a basis for actual market participation.
-
Lotus only provides technical trading analysis and trading knowledge training for students.
-
Lotus does not represent any securities company or asset management firm.
-
Lotus does not accept capital management for students.


